
Last Updated on March 11, 2024 by admin
Complete Variance Analysis
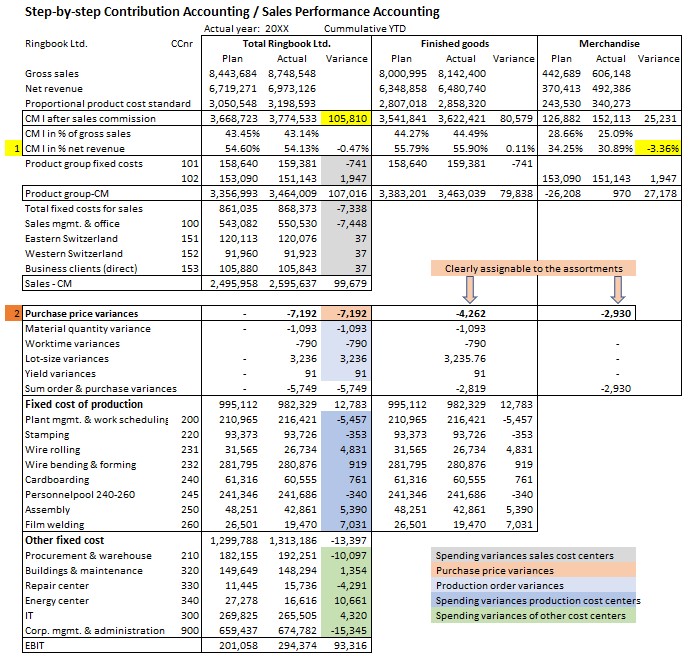
The step-by-step contribution margin accounting, also called sales performance accounting, allows for a complete variance analysis. All variances from plan are to be identified and analyzed to derive corrective measures or new plans.
In the report for year 20XX of Ringbook Ltd. it can be seen that
-
- Gross sales grew mainly due to increased sales in the merchandise product range (+36.9%). In both assortments, somewhat higher sales deductions were granted in order to realize the sales. As a result, CMI I as a % of net sales for merchandise fell by 3.36%. Overall, the absolute CM I increased by 105,810 (see yellow fields).
- Sales promotion costs (fixed costs of the product groups) are clearly attributable to assortments but not to individual product groups. They did not deviate significantly from plan. The cost centers sales management and sales territories show minor spending variances in their cost centers. Since the sales organization works for all products, its fixed costs can only be allocated to the company as a whole (see grey fields).
- The purchase price variances (line 2, red fields) could be assigned to the two assortments because all raw materials and supplies are consumed for the company’s own products. The price changes of the suppliers of the merchandising goods appear in the corresponding assortment.
- Production order related variances can be collected for each production order. Here, the summarized values per variance type are presented for the responsible production management. These variances refer only to semi-finished and finished products manufactured in-house. Therefore, they are shown in the column for the goods manufactured by the company (light blue fields).
- The spending variances (target costs – actual costs) remain. These arise in each cost center per cost-type. In the stepwise contribution margin accounting, they are shown by cost center or summarized by functional area (dark blue fields for production and light green for other cost centers). Favorable spending variances increase the EBIT. They are the expression of the fact that fewer actual costs were incurred than target costs during the period under review. This corresponds to a productivity gain relative to plan.
This company-specific design of the step-by-step contribution margin accounting shows which individual areas of responsibility contributed to what extent to the improvement in EBIT of 93,316.