Target to Actual Comparison shows the difference between the should be-costs and the actual costs in a cost center
Target to Actual Comparison
The great benefit of comparing the flexible budget with actual costs is that cost center managers can see every month how well they succeeded in implementing the plan, taking into account the orders processed. The financial goal of a cost center is to meet the cumulative flexible budget costs for the year. If the flexible budget and the actual costs are determined as described in the post “Flexible Budget”, corrective measures can be sought quickly. These should bring the cumulative spending variances back to zero in the next periods, if possible. Theoretically, a target to actual comparison could be made “real time”, i.e. daily. But because the real personnel costs and other cost types can only be calculated after the end of each month, it is recommended to create monthly comparisons per cost center.
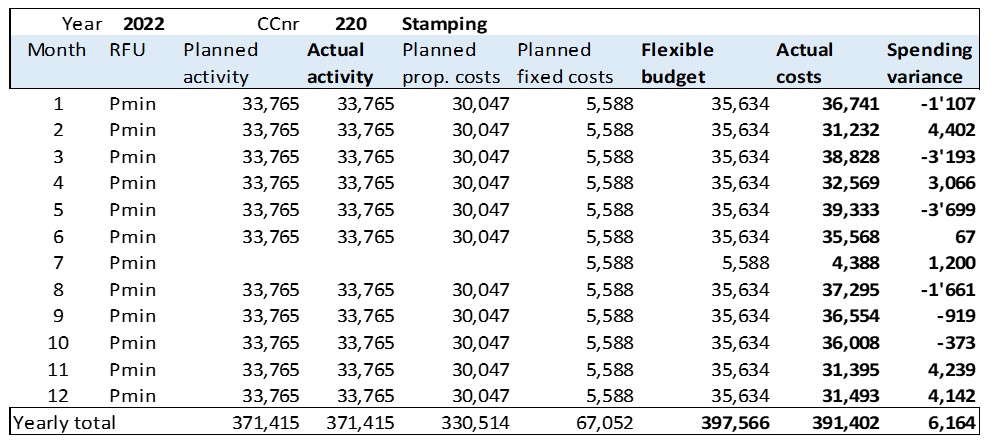
The example shows the monthly target to actual comparisons of the cost center Stamping:
Target to Actual Comparison
The spending variances show how well the cost center manager succeeded in keeping to the planned costs adjusted to the effective performance in the individual months. A positive spending variance means a productivity gain compared to the plan, a negative the contrary. These variances are corrections of the planned fixed costs.
In the month of July, Ringbook Ltd. is on vacation. Therefore, no activity is listed there, but parts of the fixed costs, especially depreciation, are also incurred in this month. The flexible budget costs are calculated according to the formula “actual output times proportional planned cost rate + planned fixed costs”, the actual costs according to the real charges.
For the year as a whole, the flexible budget was undercut by 6,164.
Actual costs
The costs charged to a cost center for a reporting period (usually a month) are recorded in various subsystems:
Invoices from external suppliers: Recording of the invoice receipt in accounts payable with specification of the consuming cost center.
Consumption of auxiliary and operating materials from the warehouse: Recording by means of material consumption slips by multiplying the purchased quantity, valuated with the planned purchase price of the auxiliary or operating material. The planned purchase price is used for valuation because the purchase price variances are reported to the purchasing department, since this department triggers the purchase orders.
Personnel costs: Debit of the presence hours of the month of the employees of the cost center, valued in each case with their planned presence hour rate (data source is the personnel cost plan).
Charging of activities of other cost centers: Units consumed during the reporting period (mostly hours, kWh, km) valued at the proportional planned cost rate of the providing cost center. As a result, neither the fixed costs of the issuing cost center nor the variances incurred there are passed on.
Overall: The fixed costs and the purchase price variances remain in the sender cost centers, since they can only be recorded and accounted for there. In this way, target to actual comparisons are created in the receiving cost centers without including price or cost-rate changes from serving areas. The resulting variances are the responsibility of the respective cost center manager.
Calculating the planned costs of the actual services provided.
Flexible Budget
When performing a target to actual comparison, cost center managers should be able to check monthly as to whether or not costs they can manage themselves are “under control”. Given that the annual plan is approved by the organization’s management who releases the cost center budgets, the budget must be adhered to. However, during the year various factors can deviate from the plan, including:
Sales and production quantities,
Purchase prices,
Manufacturing processes efficiencies, and
Employees retention rate.
A simple comparison between planned and actual costs does not help cost center managers in their search for possible corrective measures because they lack a reference to the actual performance of the period under review. As a benchmark the flexible budget of the cost center should be calculated:
Flexible budget costs =
actual activity x proportional planned cost rate + planned fixed costs.
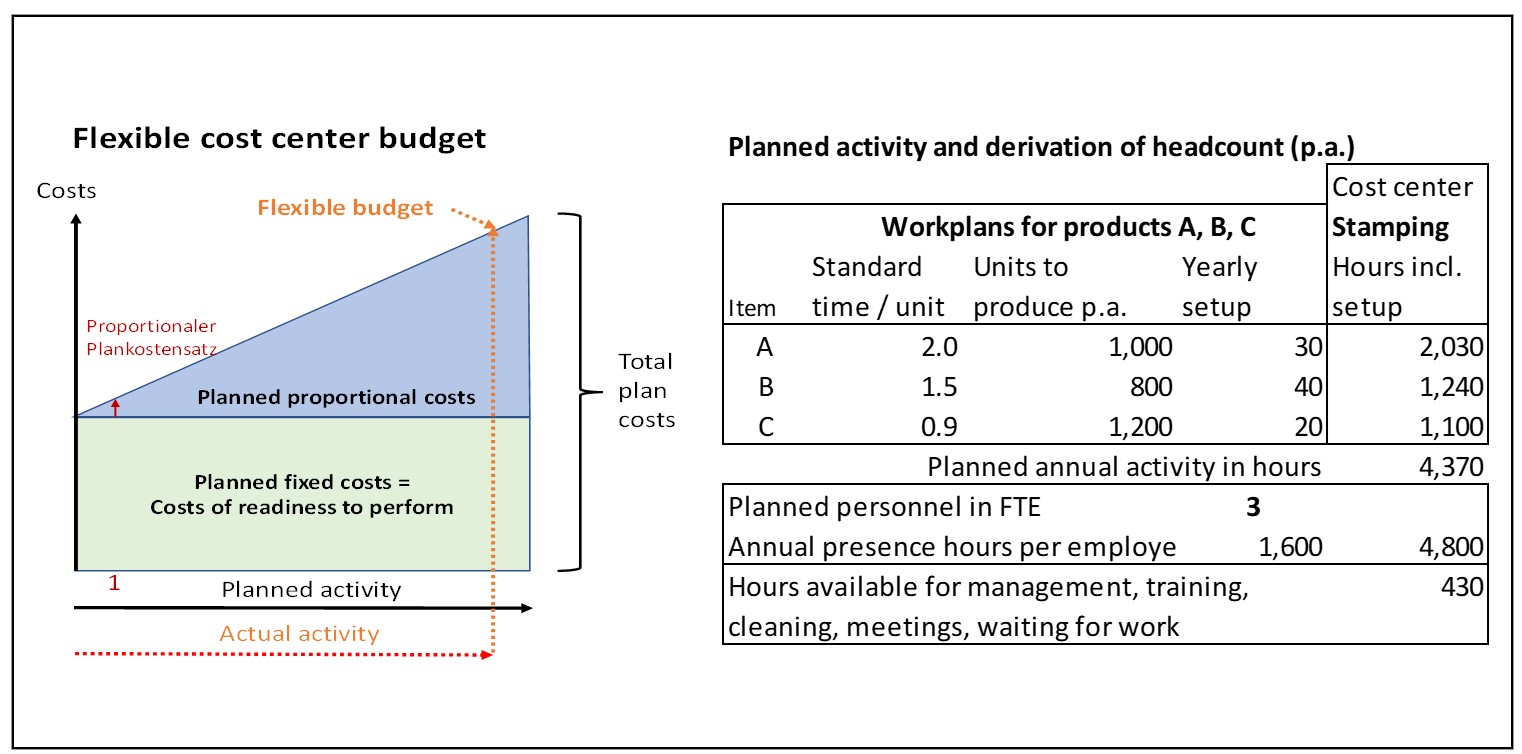
The flexible budget shows the planned cost of work actually performed in a period. If the activity performed in the period under review deviates from the planned activity, the proportional costs of the cost center will change, but the planned fixed costs should not. In the example below, actual employment is slightly less than planned employment. Therefore, the proportional plan costs is less than the annual plan, but the planned activity capacity (fixed) costs remain the same.
Flexible budget
The flexible budget cost is thus the cause-related yardstick for assessing the total costs actually incurred by the cost center. If the cost center managers keep to their flexible budget, they will have achieved their cost target. If negative variances from the target costs occur, ways must be found to cumulatively reach the flexible budget again in the following months.
If cost centers perform activities that are not directly caused by a production order, a customer order, or by internal projects (e.g. research and development), they also have no planned or actual activity and consequently only fixed costs. In these cases, the flexible budget corresponds to the planned costs.
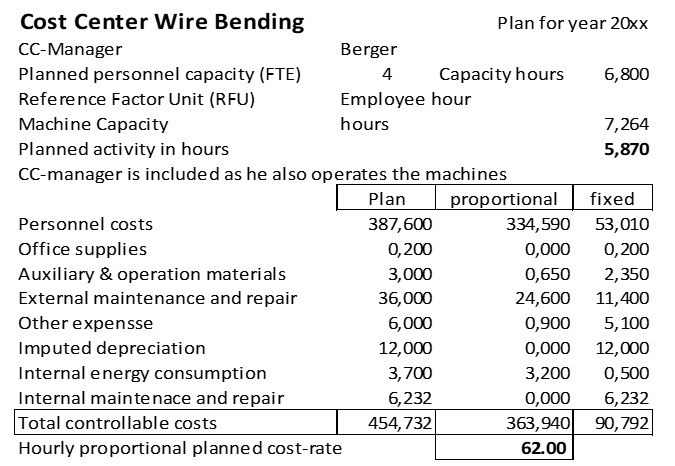
For the wire bending cost center in the example company the annual plan is as follows:
Cost Cetner Wire Bending
The installed capacity of the production equipment is 7,264 hours, which is sufficient for the planned production time.
The cost center has a planned workforce of 4 people who are planned to work a total of 6,800 net hours. This includes the working time of the cost center manager for planning and controlling the cost center.
The complete planned personnel costs of the cost center totals 387,600. The average hour worked (including the cost center manager) will thus cost 57.00 per hour (presence time).
According to production planning 5,870 employee hours will be necessary to execute the planned activity. This means that 5,870 hours at 57.00 per hour will “slip” into the products to be manufactured. This corresponds to 334,590 planned proportional personnel costs. The 53,010 difference between the planned personnel costs represents the costs for work not directly related to the products, i.e. the planned fixed personnel costs for the year.
In line with this, the other planned costs were divided into their proportional and fixed portions. Dividing the proportional budgeted cost of 363,940 by the planned activity of 5,870 hours yields a budgeted hourly proportional cost rate of 62.00 for wire bending. This rate is used to calculate the proportional costs of all products that will be processed in this cost center (see the post “Standard Cost Calculation of Products”).
If the activity of the issuing cost center is caused by a direct order of the receiving cost center or by its activity, there is a direct cause-and-effect link between the serving and the receiving centers. The planned proportional cost-rates can thus be charged to the receiving cost centers. The issuing cost center has its own planned and actual activity. The activities it performs for other cost centers can be measured. (Examples include repair and maintenance shop, laboratory, and energy cost centers). Thus, the respective cost center also has a proportional plan cost rate and its flexible budget is dependent on the activity performed for others during the period.
If the activities of a cost center are performed for the entire company, there is no direct cause-and-effect relationship between the producer of the activity and the users of the output. Therefore, the costs of such cost centers cannot be allocated to other cost centers according to their cause (e.g. reception, personnel administration, internal training, sales, production planning, finance, the majority of IT costs and top management). The IT costs for the ERP- or for the management accounting system are incurred for all cost center managers who use ERP data. The costs of generally used services cannot be charged to the users according to their origin (forced consumption). Due to this lack of causation, the allocation of fixed costs to other cost centers makes no sense. In other words, fixed costs should not be allocated to other cost centers, cost center managers should assume responsibility for their own flexible budget.
Flexible budgets are thus a prerequisite for the introduction of a Resource Consumption Accounting system RCA and for Contribution Accounting.
Include the non-wage personnel costs in the hourly presence rate of employees.This simplifies cost accounting.
Personnel costs in Cost Accounting
In this post we understand personnel costs as the costs for the work done by the employed persons . The costs of external persons who work for the organization are not included since the wages of these persons are accounted for and paid out in the performing organization.
Each person employed by an organization is assigned to a cost center, usually the cost center of the person’s boss. If employees perform work for projects, their personnel costs are incurred in the cost center of origin and, as far as measurable, are charged to the projects as internal services with corresponding hourly rates. Each employee is assigned to one and only one cost center. Should a person have two employment contracts in the same company, these are to be assigned to the respective cost centers.
Cost center managers are responsible for the costs of their personnel . Therefore they want to know the monthly personnel costs of their management area in plan and actual.
Requirements for the personnel department, financial accounting and software
Payroll accounting is becoming increasingly complicated, since different types of non-wage labor costs have to be taken into account and since payments occur at different times, e.g. monthly salary, vacation pay, Christmas bonus, child allowances, gratuity, bonus. For each employee, the payroll must usually be created monthly in the payroll system for each wage type and wage deduction type. This detail is necessary that employees can understand what net amount is due to them and is to be paid out per payroll period.
The payroll accounting system must also be structured in such a way that the social insurance companies, the governmental control organizations and the auditors can understand whether all wage and wage deduction items have been calculated correctly. For the company’s own financial accounting, this system must prepare the expenditures for wages and salaries and deductions according to expense types so that they can be posted and checked on an accrual basis.
In most countries, employees receive a monthly pay slip. This shows the contractual gross wage earned in the period and which allowances for overtime and shift work have been accounted for and credited. If supplements for 13th month wages, vacation or Christmas bonuses have been agreed in the employment contract, these items are also listed in the wage statement for the month of payment.
Deductions to be borne by the employee are subtracted from the resulting wage total, e.g. employee contributions for social security and health or accident insurance, in various countries the wage taxes, contributions to pension insurance and similar. This results in the net wage to be paid out for the individual. The company must pass on these deductions to the relevant governmental organizations or insurance companies.
In cost center accounting, however, it is not the cash flows and settlements that are relevant, but the consumption of a reporting period.
Information requirements of cost center managers
Cost center managers are responsible for the costs incurred in their management area that can be directly influenced by them. Consequently, cost accounting must be designed that the personnel costs of a period can be compared with the work performed in the period.
For this purpose, it must be calculated in planning how much a certain person should cost per hour of presence according to the employment contract, if all wage components and the non-wage costs to be paid by the employer are included. Example:
Personnel Costs in Cost Accounting
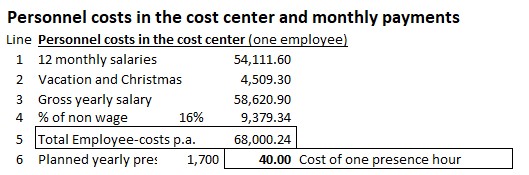
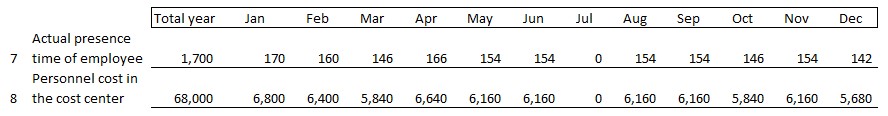
In the example, it is assumed that the person, including the 13th month’s salary and possibly other fringe benefits, is to receive an annual salary of 58,620.90 and is to be present for 1,700 hours (212.5 working days of 8 hours each) in accordance with the annual work calendar. For the non-wage costs to be paid by the employer (i.e. unemployment insurance, pension plan, possibly health insurance), a surcharge rate of 16% on the gross wage sum was calculated. In total, this employee costs the company EUR 68,000 per year or EUR. That is 40.– EUR per planned hour of presence. This is the key information for the cost center manager: For each work/presence hour, this person costs the company EUR 40.
If this person works exactly the 1,700 hours during the year (line 7), the following personnel costs result according to the recording of the presence time (line 8), for which the cost center manager is responsible:
Monthly presence time
In the example the company is closed for company vacations during July. Since the employee does not have any presence hours in July, no personnel costs are debited for him, although he receives a salary payment. This is because the hours were worked in the other months (the total presence hours in line 7 is 1,700 hours). Even if the employee is paid the same wage every month, it makes sense for the cost center manager to see the personnel costs based on the really worked hours .
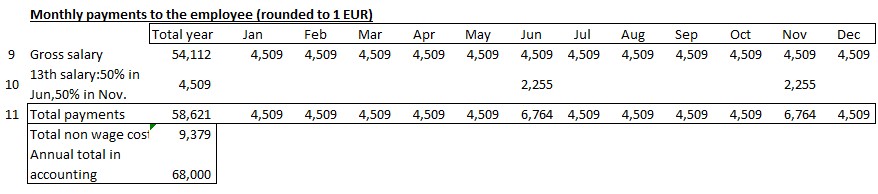
However, in payroll accounting and consequently in financial accounting, the payment values can be found. They differ from the costs:
Monthly Payments to Employee
In the payrolls, Monthly Payments to Employee 1/12 appears as the gross monthly wage, cf. line 1. Vacation and Christmas bonuses are also included in personnel costs but are paid in June and November. Payments of child allowances are not listed because they are reimbursed to the company by Social Security. Social security costs charged to the company are included in the 16% for non wage costs (line 4). They represent the amounts the company (not the employees) must pay for unemployment insurance, retirement benefits, and possibly health insurance (9,379.34).
The monthly personnel costs are calculated by multiplying the hourly presence rate (line 6) by the time worked. Thus the personnel cost for the work done in a period is charged to the cost center, not the amount from the pay slip (line 8). The data source for charging personnel costs to the cost centers are the amounts from cost center planning and the presence times, not the payrolls for the employees.
Necessary personnel cost-types in management accounting
In many companies it is sufficient to set up only one cost type “personnel costs” in management accounting. This is because in most cases, a person’s hourly presence rate includes all compensation, as shown in line 6. Cost center managers cannot influence the conditions for non wage labor costs because they are governed by regulations. Therefore, as shown in line 4, they can be included directly in the planned hourly rate. This facilitates planning and control for cost center managers.
Additional personnel cost types indicated by
Shift bonuses and/or bonuses for weekend work
Bad weather bonuses (construction industry)
Danger bonuses
Overtime bonuses and
Bonuses on achieved sales or contribution margins
are to be aligned. This is because these bonuses are planned and settled on the basis of hours actually worked or sales results achieved.
“Imputed depreciation is the cost equivalent of the value depletion of long-term usable operating resources (Wolfgang Kilger, Flexible Plankostenrechnung und Deckungsbeitragsrechnung, 9th improved edition, Wiesbaden, Germany, 1988, p. 398)”.
Imputed depreciation should lead to corresponding amounts of money for replacement investments being “bunkered” in financial assets in the operating profit and loss account in order to be able to procure replacement equipment if necessary and thus continue to fulfill the purpose of the business. The depreciation equivalents mentioned by W. Kilger must be calculated on the basis of the replacement values of the investments from the point of view of value preservation.
The result is that imputed depreciation should not be calculated o from the basis of the historical acquisition value of equipment that can be used in the long term, but on the basis of the amount that would have to be paid at the end of the year for equipment with the same performance. In our view, the profit potential of a company is only maintained when equally efficient resources can be bought again. Only when the existing elements of the fixed assets can be procured again at current purchase prices is the substance preserved. Only the profit after deducting depreciation that preserves substance can be distributed to the owners / shareholders with a clear conscience.
The valuation at replacement value and the derivation of imputed depreciation from this requires that it be clarified before the annual financial statements what changes in purchase prices are to be expected for the various parts of the fixed assets. There are many reasons for impending cost price increases or expenditure for updates:
Inflation in the procurement markets
New technical or legal regulations to be complied with
Changes in safety regulations for the operation of systems (and buildings)
Adaptation of computer programs, program extensions and release changes
Change to another machine supplier because the previous one no longer exists.
On the other hand, systems to be replaced can become cheaper to purchase because physical system parts are replaced by electronics or metal by plastic.
Both with expected rising and falling purchase prices of assets and intangible assets, imputed depreciation must be recalculated for the year to plan and taken into account in the planned cost calculations. This is because in management accounting, like other costs, depreciation is one of the factors determining the level of profit.
Imputed depreciation should not only be calculated for long-term assets such as buildings, equipment, machinery and vehicles. Operating resources also increasingly include rights and potential benefits of a non-physical nature such as ERP and CRM systems, rights of use and usage and sale, purchased customer addresses and time-limited usage licenses. If such potential benefits lose their value over time and new investments are required to maintain them, the corresponding estimated amounts must be included in the replacement value, which in turn leads to higher imputed depreciation.
Sustainably successful corporate management requires the inclusion of imputed depreciation in the internal income statement. This prevents money from being distributed to the owners that will be needed to maintain the company’s potential for success and thus its continued existence.
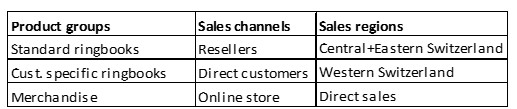
The example company Ringbook Ltd. sells various ring binder types as well as merchandise items to approx. 50 customers. In each of the regions of Eastern and Central Switzerland and the rest of Switzerland, one salesperson supports the resellers. Another sales representative sells the entire range to corporate customers who use the ring binders for themselves. All items can also be ordered directly from the online store. The sales and marketing manager is responsible for exporting the ring binders to other countries. The following dimensions are therefore to be provided for the planning and control of sales:
Sales dimensions
These cost centers were defined for the Marketing and Sales organization:
Sales management (incl. export and online store)
Sales Eastern and Central Switzerland
Sales rest of Switzerland
Sales to direct customers
Sales promotion of own products
Sales promotion merchandise
Such structures for planning and controlling the sales dimensions and the cost centers of marketing and sales can be found in many companies in a similar form.
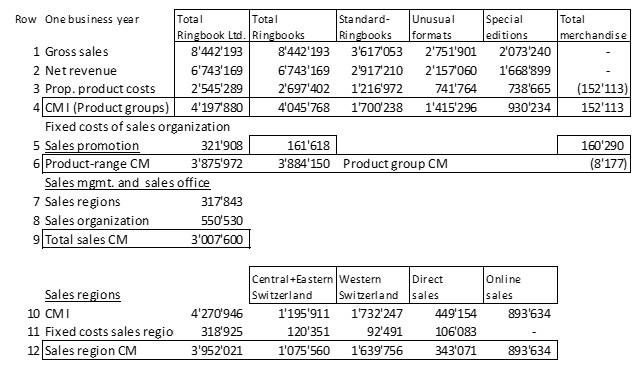
For an example year the following contribution margins resulted:
Customer profitability
In Ringbook Ltd. the gross sales, the sales deductions, the proportional planned manufacturing costs and the contribution margin I (CM I) per sales order item can be determined. Aggregation of all order items of a customer shows the CM I per customer and year. Lines 1 – 4 show the totals per product group.
Sales promotion is done separately for the product ranges own products and merchandise. For each of these a sales promotion cost center is maintained, each with its own personnel. Their costs can be clearly allocated to the respective assortment, but not to the individual customers or items (line 5). The contribution margin of an assortment can be seen in line 6.
Actual sales are generated in four sales territories. There are three sales cost centers for the areas of Eastern and Central Switzerland, the rest of Switzerland and direct sales to companies. Their costs are incurred for servicing the customers in the three sales areas and can therefore be clearly addressed to the sales area contribution margins (lines 10 – 12).
The sales manager and his office staff take care of the export sales and the operation of the online store. No separate cost centers can be defined for these areas, because the work is performed in conjunction with all the other tasks of the sales management and office staff. All costs of the cost center Sales Management and Internal Sales Support are therefore incurred for the entirety of the sales. They cannot be allocated to sales areas or product groups according to source (line 8).
In multilevel and multidimensional contribution margin accounting it is possible to calculate absolute contribution margins for various areas of responsibility after deducting the directly assignable fixed costs. The managers of such areas can be responsible for CM I and the fixed costs directly caused there (line 9).
Profitability of a customer
If the invoiced items and the proportional (planned) product costs of the sold items are known for each customer, the contribution margin of a customer can be calculated. However, if parts of the fixed costs are also to be allocated to individual customers, multiple unsolvable allocation problems arise:
The internal sales department handles all incoming orders
The sales manager takes care of the planning and control of the entire sales area and this across product groups, sales channels and sales territories.
The sales promotion units promote the product ranges of own products and merchandise in all sales regions and sales channels.
The regional sales representatives serve customers of different sizes in their areas, who have different needs for advice.
Marketing and sales costs are also incurred for addressees who do not become customers.
There is no direct causal relationship between the contribution margin of a particular customer and the fixed costs of sales and all other cost centers of the company. An allocation of these fixed costs can only be practiced by using allocation keys (or drivers). Even using differentiated allocation keys does not help as no cause-effect relationship exists (see the post “Full product costs are always wrong!”).
If a new customer is acquired, it can be estimated what and how much he will purchase annually and how much contribution margin could result to cover fixed costs and profit. However, the prerequisite is that management accounting is structured as a multidimensional contribution margin accounting.
The level of fixed costs is determined by the managers of the respective management areas. If an existing customer drops out, the fixed costs do not change, but there is less contribution margin available to cover them.
In a company with several customers, it is therefore impossible to clearly calculate the EBIT of a single customer and thus its profitability.
Financial evaluation of multi-year projects at the time of decision-making.
Dynamic Capital Budgeting
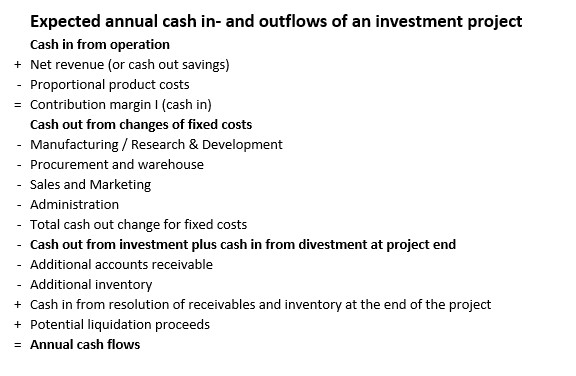
The basic principle of an investment: Money is spent today in order to have more cash returns or less cash outflows in the future. Companies, NGO’s, NPO’s and private investors have to decide again and again whether they should invest their available money in companies, plants or process improvements. An investment decision requires a plan-calculation, which should show whether the planned cash outflows and cash inflows can achieve a return in line with the market during the expected useful life of the investment.
Usually investments are expenditures for the provision of a service potential that are intended to generate higher cash inflows or reduced expenditures during the planned period of use.
Simple example 1: Contracting out the maintenance of the garden surrounding the plant to an external organization.
Consequences of this decision are: Additional expenditures for the grounds maintenance contract and eliminated expenditures for paying the former in-house gardener.
Complex example 2: Production and sale of a new product group by an existing company.
In example 1, from a financial point of view it is sufficient to compare the balance of the expected payments for the grounds maintenance contract with the personnel costs for the work previously performed internally.
In example 2, additional net sales and thus additional contribution margins are to be achieved with a newly introduced product group. To generate these additional cash returns initial investments in fixed assets will be necessary, the expansion of net revenue will increase receivables and inventories, and more personnel will be required in individual functional areas. These actions will lead to additional cash outflows. It should also be taken into account that both net revenues and cash outflows will be subject to the life cycle of this new product group, i.e. will lead to different net cash flows in each year of the investment project.
In both cases, cash flow analyses must be prepared for the upcoming decision. For the more complex example of the introduction of a new product group, these considerations must be prepared for a multi-year horizon, because the inflows and outflows of money can occur in different years. In our experience the following structure is suitable for this purpose:
Dynamic Capital Budgeting (only planned values)
This structure can be used generally for investment appraisals, since it contains all elements of cash inflows and outflows. Regarding example 1, the cash outflows would be the payments for the grounds maintenance contract, the cash inflows would be the saved cash-out personnel costs for the previous employee. The introduction of a new product group (example 2) requires the entry of all items listed in the table above because this investment project affects both the income statement and the balance sheet.
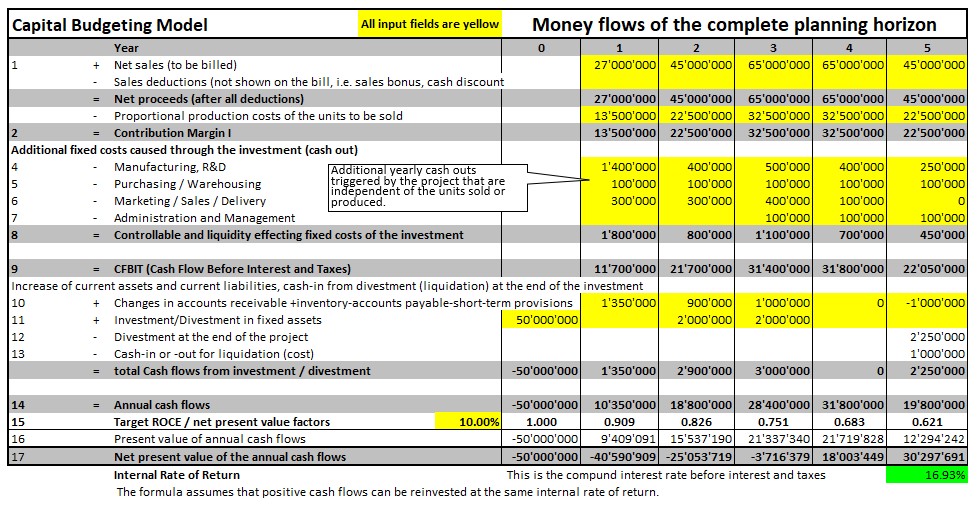
Therefore, it is advisable to prepare the investment appraisal in such a way that the expected annual cash flows can be identified and discounted for each year. In the product launch example, these cash flows are planned as follows:
Present Value of an Investment
Year 0 is the beginning of the implementation of the decision. The main investment of 50 million has to be paid then (line 11). For the years 2 and 3 it is assumed that additional investments will be necessary to increase the production capacity of the plant.
The annual net revenues expected from the project are entered in line 1. The development of the net revenue corresponds to the expected life cycle of the new product.
In line 2, the planned proportional costs of the expected yearly sales are calculated (50%).
In year 1, further payments of 1.0 million are incurred for introductory work. In addition, it is expected that the staff in Production Planning and Control will need to be increased, resulting in 0.4 million additional annual expenditure (line 4).
Further additional personnel are required in the areas of purchasing and warehousing as well as marketing / sales / distribution. The expansion of the business volume will also require an additional person in administration in the years 3-5 (lines 5-7).
The total annual cash outs for internal tasks of this project (additional personnel) can be seen in line 8).
Line 9 shows the net benefit of the investment project (yearly net cash inflows).
Lines 10 and 11 show the net impact of the project on fixed assets, accounts receivable and current liabilities over the years.
At the end of the project (here year 5), the built-up receivables and inventories are liquidated again. There may also be liquidation proceeds for the asset that is no longer in use (lines 10, 12 and 13).
The annual balance of cash flows is shown in line 14.
The example shows 5 plan years but can be extended for more years as needed.
Adding up the nominal yearly net cash flows in line 14, it can be seen that the investments will be completely paid back during year 3 (simple payback period).
The time value of money
Anyone who provides money, whether it is the company itself or an investor, expects to be remunerated for this service in the form of interest. If, for example, an annual interest rate of 10% corresponds to current money market conditions, a company must pay an interest of 100 for a loan of 1,000 at the end of a year. If the lender is to make the money available for several years (example 2), he will ask himself whether he will be remunerated for his investment with compound interest. Consequently, from his point of view he wants to know at the time of decision what the present value of the investment will be over the entire term of the loan and whether this return will stand up in comparison to other possible investments.
Investors therefore ask themselves: How much will I get back for my investment at the end of one year or at the end of the project? If, as in the example, he sets a target interest rate of 10% per annum, the result is:
The 100 are to be paid at the end of the year. So the value of the interest payment at the beginning of the year, respectively at the time of the decision for the investment is 90.9091 ((100 : (1+interest rate 10%) = 90.91).
If the interest of 100 accrues only at the end of year 2, the 90.91 must be divided again by the interest rate (90.91 / (1+interest rate)) = 0.826). In the compound interest calculation, the formula 1 / interest rate ^number of years is used. This results in the present value factors, which are shown in line 15 for the rate of 10%. The corresponding present values of the plan years are shown in line 16. Line 17 shows that the accumulated present values will only at the beginning of year 4 be sufficient to pay for all the investments and divestments and for the 10% compound interest (lines 10 and 11) at 10%.
Overall, according to the plan, by the end of year 5, the cumulative present values in example 2 should be 30.298 million higher than the net investments in all the years of the project. In setting up the example, it was assumed that the life cycle curve of the product group will go through its build-up and growth phase in years 1-2, will reach saturation in years 3 and 4 and that the phasing-out of the life-cycle will begin in year 5.
Pitfalls in the application of Dynamic Capital Budgeting
Depreciation has no place in an investment calculation. This is because by taking the investment amounts into account the cash outflows are already included.
Likewise, tax consequences of investments are generally not included, since the profitability rate to be achieved refers to the profit before deduction of interest and taxes.
Saveable tax amounts are also not relevant to the decision because taxes are calculated from the reported profit after interest. The latter can also develop negatively if an investment project is going well but the market situation leads to a drop in sales of other products and thus to less annual profit.
As the name implies, capital budgeting is a forward-looking view. The method is always based on planned quantities and values because it is intended to support decision-making in strategic and operational planning. Whether the investment has really increased productivity can only be determined by evaluating the actual data from management accounting.
With the present-value approach the investment appraisal becomes dynamic.
Download the Excel model for the quantification of investment projects here and adapt it to your own needs. Copying the formulas in new rows allows to include additional years. The model is particularly suitable for the quantification of strategies. With the help of the Excel formula “Internal rate of return” also the internal rate of return of the project can be calculated (see the 16.9% on the right in line 18). This helps to compare competing projects. But it should be noted that this formula assumes that cash returns can also be reinvested at the rate of 16.9%.
Market rate of interest
In the presented example an interest rate of 10% was assumed. But which interest rate should be applied for the assessment of a real project plan or a general investment?
For this purpose, the interest rate in line with the market for companies with the same risk must be determined. The procedure for doing this is described in the post “Profit in Line with the Market“. There, it is also noted that the 10% assumed in the example above correspond to the market reality in German speaking countries and in the US.
Because many organizations operate internationally, communication is increasingly multilingual. For this reason, we have expanded and updated our overview of technical terms in the world of controlling and management control systems.
Find more than 2,500 technical terms in English, German, French and Italian.
It seems more interesting to use the activity-based idea for finding, setting and negotiating sales prices, that means, for Activity Based Pricing than for costing.
Activity Based Pricing
Five of ten case studies published so far by the Profitability Analytics Center of Excellence PACE (see Management Accounting Practice Reports) deal with the question of how the unequal, only partially measurable use of a company’s support areas and capacities can be taken into account in sales pricing for different customers.
Specifically, the following cost pools should be included in sales pricing for different customer/product combinations:
Costs of procurement and warehouse logistics, which vary for different product groups,
Scrapping costs for expired or unsaleable products per product group,
Distribution costs such as transportation, storage, replenishment of shelves, delivery cycle (daily, weekly, monthly) per customer,
Customer care costs for order processing, handling of returns and complaints and general support by the sales force.
Although these fixed cost blocks cannot be allocated to an individual product according to cause, it is possible to calculate average values per activity and then take these into account when setting prices for different customer groups or sales channels.
This does not change anything in the management accounting system or in the contribution margin methodology, nor does it change the decision-relevant internal inventory valuation (at proportional standard costs). This is because fixed cost center costs are related to executed processes.
Activity Based Pricing is intended to support marketing- and salespersons in justifying the estimated costs of fixed cost processes to customers. For this purpose, it is not necessary to adapt the management accounting system, which is used for planning and control, but parallel calculations can be created.
Application example Ringbook Ltd.
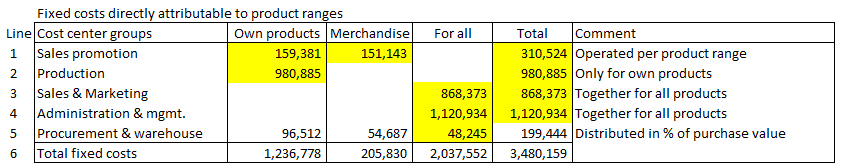
For the example company Ringbook Ltd. the following table shows the fixed costs for 2021 at the lowest product level to which they can still be clearly allocated, i.e., without using any fixed cost allocation factors.
Direct fixed costs per product range
Of the total fixed costs of around 3.48 million, 1.44 million can be allocated to the two product ranges, while 2.04 million are incurred for the entire sales organization. The fixed costs for purchasing and warehousing were broken down in proportion to the purchasing values of the areas (own products, merchandise, investments and projects (general)). This took place under the arbitrary assumption that the costs of the purchase department are driven by the purchase volume.
With this classification the lowest level of the allocation of fixed cost blocks is reached in the example company. For:
Sales promotion is performed in each case for all products of a product range, for all customer groups together.
In sales and marketing all products are sold to all customers and a sales order can include one or more positions.
In production, manufacturing orders are processed for both semi-finished and finished products, which is why their fixed costs are incurred for all manufactured goods.
Administration and management work for all products.
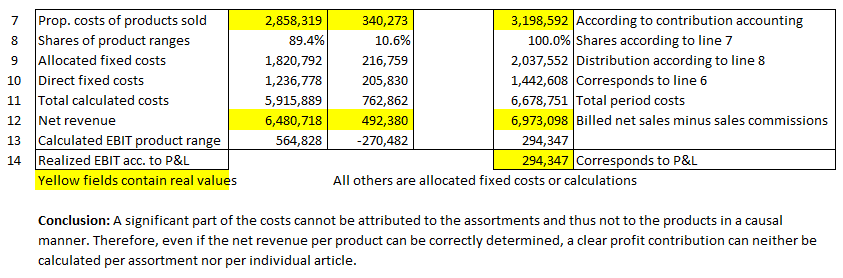
The next part of the table (lines 7 – 14) is based on the proportional manufacturing costs of the products sold in the two assortments of own products and merchandise. Since the calculation is based on bills of materials and routings of the individual articles and the purchase prices for the individual merchandise products are known, their proportional costs can be calculated for each assortment according to their origin (line 7). From this, the proportions of the general fixed costs per assortment can be calculated in lines 8 and 9 (89.4% and 10.6%). In line 10, the directly attributable fixed costs are taken from line 6 of the previous table. This results in the full costs per product range in line 11.
Activity Based Pricing
Comparing the net revenues in line 12 with the calculated full costs in line 11, reveals the calculated EBIT per product range (line 13). The total EBIT of 294,347 corresponds to the EBIT in the P&L (line 14).
After this allocation of fixed cost blocks to products it can be seen that the large share of EBIT comes from the own products. This was already apparent from the stepwiseCM-calculation.
If the activity-based fixed cost allocation presented here is taken as the basis for pricing, the prices of merchandise would have to be increased and those of the own products reduced. In this way, the merchandise would achieve a higher calculated EBIT and the lower prices of the own products would allow sales volumes to be increased. However, the merchandise range has only been sold for two years, so it is still being built up. The sales prices have been set by observing competitor prices, so a price increase would lead to a drop in sales. Otherwise it makes no sense to lower the prices of own products, because no significant increases in production volumes are possible with the existing production capacities.
In summary, for the estimation of activity costs the fixed costs of a cost center are to be assumed and these are to be compared with the process quantities. Using the example of a purchasing department it is understandable that an initial purchase from a supplier takes more time than a reorder. The personnel costs in the marketing department for producing a sales catalogue remain the same whether one or thousands of catalogues are printed. But the full cost of one catalogue will change. The question whether the costs of the catalogues are to be split between existing and potential customers remains open.
Outlook
The more interwoven the internal service relationships are in the production and marketing of products, the less meaningful a cost-based sales price calculation becomes.
For the determination of gross and net sales prices, the allocation of fixed costs to customers and products can be a support. However, the net prices of competitors are more important.
Activity Based Pricing should in any case take place outside of Management Accounting. It is used to set prices but does not directly change any costs.
Activity Based Costing allocates fixed costs of production, sales and administration to individual products. How relevant is this for decision-making?
Activity Based Costing (ABC)
ABC was published for the first time 1971 by Professor George Staubus under the title “Activity Costing and Input Output Accounting”. CIMA, the Chartered Institute of Management Accounting, designated ABC in 1988 as a cost accounting method, which assigns the costs of resources consumed to the final products. This allocation is to be achieved with the help of consumption estimates and cost drivers:
Resources -> cost drivers -> cost objects.
The purpose of these allocations is to estimate or determine the full costs of products, services and performed work. Thus, ABC is a further attempt to assign, if possible, all costs of an enterprise properly to the individual unit sold. Activity Based Costing was, in 1999, so up-to-date that Horngren/Bhimani/Foster/Datar dedicated a whole chapter to the topic in their book “Management and Cost Accounting” (pp. 344-370). This development was taken up also in the German speaking countries. Peter Horváth extended ABC to Process Cost Calculation (P. Horváth, Controlling, 7th edition, 1998, p. 532 ff.,). “The Process Cost Calculation is to be understood as a method to allocate overhead costs to products according to the German account system for external reporting (ibid. p. 533, translated by L. Rieder)”.
In ABC as well as in Process Cost Calculation the fixed costs of manufacturing, selling and administration are allocated to other cost centers and from there to the different product units (see ibid., p. 542). The intention is to be able to better assess the profitability of a product or service and to enable “fact-based pricing”.
In the following it is examined how far ABC can lead to more decision-relevant cost information and which internal inventory evaluations are decision-relevant.
Cost Elements in Activity Based Costing
In the cited book “Management and Cost Accounting” (p. 345 ff.), three guidelines for determining activity costs are defined:
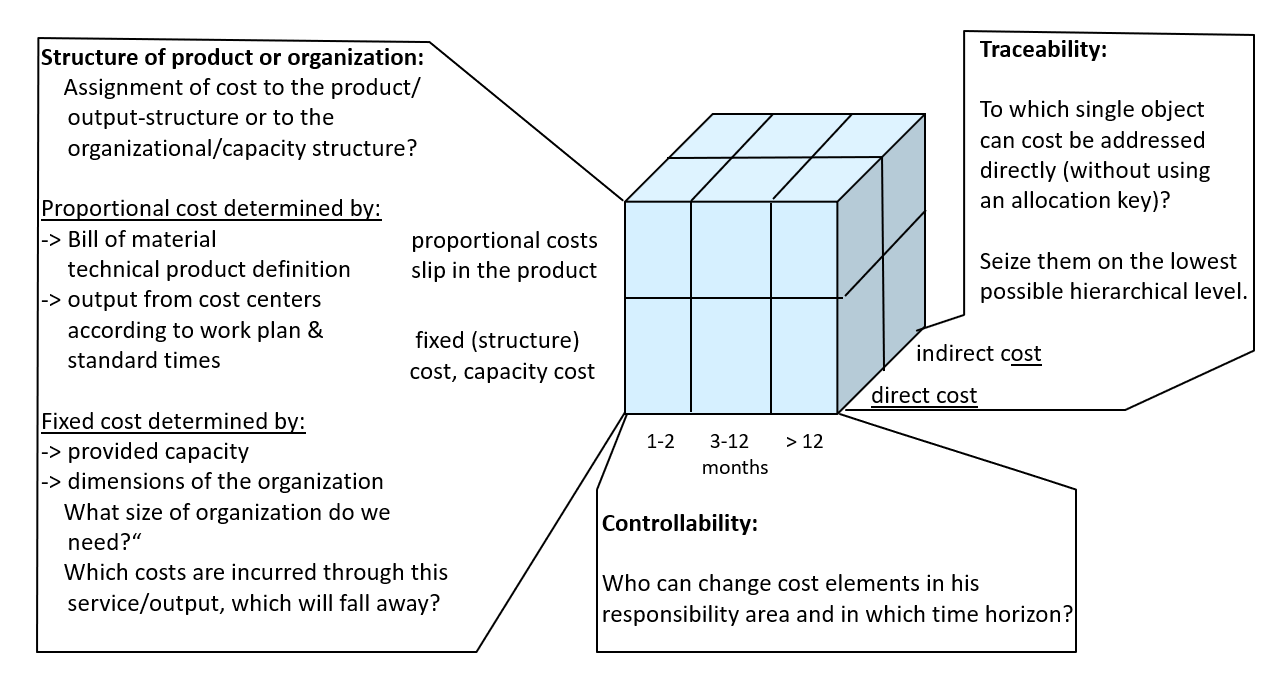
Account for all costs either as direct costs of a product or a cost center. If direct allocation to a cost center is not possible, the cost items are to be charged to a higher aggregated cost center. In the cost cube (see below), these are the direct costs of the respective cost center under consideration (Traceability).
Refine the cost center structure so that each cost element can be assigned to one and only one cost center. While this leads to a massive increase in the number of cost centers to be planned and tracked, it also leads to clear responsibilities for the cost center managers.
Define a cost key for each cost center that represents a direct cause-and-effect relationship between a cost center’s activity and its costs. This requirement leads to the allocation of fixed costs from one cost center to another and from there to the products. It thus contradicts the requirements for cause-related cost splitting between proportional and fixed.
From a management perspective the guidelines 1 an 2 can be agreed upon. However, guideline 3 contradicts the rules of flexible budget costing, as it leads to fixed costs also being allocated to manufactured items and services.
The cost cube (compare the post “Management-relevant cost terms”) shows that the proportional costs are caused directly by the quantity of a product or service produced (direct cause-and-effect relationship). The fixed costs, on the other hand, are the result of decisions by the cost center manager and his superiors.
The most important parts of these fixed costs are the personnel costs for the management of the cost center and the costs for the calendar-dependent depreciation of the plant. They are created so that the cost center is ready to perform, even if production is not taking place. All fixed costs are period-dependent, not piece-dependent and can therefore not be attributed to a manufactured unit in accordance with the cause.
Cost cube
If the total cost center costs of a period were divided by the cost center services provided by that period, a different full cost rate would result for each month. This would be useless for the management of a cost center as well as for the inventory valuation of semi-finished and finished products and would cause variances for which no one is responsible.
ABC is thus also to be understood as full cost calculation. For each cost center an activity unit, called a cost driver, is specified, which measures the demand of the resources. All costs of a cost center are then divided by the number of performed activity units. The resulting cost rate thus consists of proportional and fixed cost portions. This is indicated in the following example for the food wholesaler Netto AS (translated from “Management and Cost Accounting, pp. 350 – 352).
Activity Based Costing at Netto AS
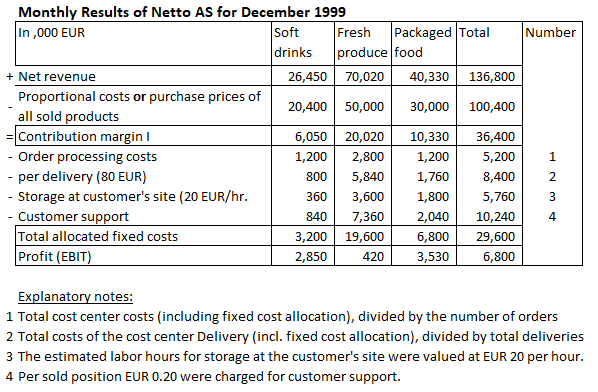
Since Netto AS is a trading company, which itself does not change the products it purchases, the difference between net revenue and proportional purchase costs of the sold products results is contribution margin I.
For the allocation of the cost center costs to the product areas of Netto AS, however, the conventional full cost method was used. For this purpose, the total costs of a cost center including allocations from supplying cost centers (e.g., energy, personnel administration or corporate management) were divided by the presumed characteristic activity quantity of the cost center. For example, the cost center “Customer Support” recorded total costs of 10,240 in 1999 and processed 51,200 order items with them. This results in a fixed cost rate of 0.20 EUR per order item, again including all allocations from other cost centers. This rate is multiplied by the number of order position of a product range, which results in the amount of 7,360 for fresh products.
Activity Based Costing
Taking all these cost allocations into account, the result is that Fresh Produce contributed “only” 420 to EBIT in 1999. One could conclude from this that the sale of fresh products could be abandoned and the time gained in the cost centers could be used for the more profitable product areas or the personnel could be reduced to a corresponding extent.
A look at the contribution margin line reveals that this would probably be short-sighted. This is because fresh product sales generate 20,020 contribution margin I, i.e., more than half of the total CM I of 36,400. The lost 20,020 CM I would have to be saved in fixed costs, which would primarily mean personnel layoffs. The risk is great that in this case there would also be a lack of qualified personnel to carry out the sales and delivery activities for the other product ranges. In addition, the storage areas would become too large and the installations no longer in use, including computers and software, would still have to be depreciated. The fixed costs of the central functions of Netto AS, e.g., management, IT or personnel administration are already included in the sales processes in the numerical example (numbers 1-4). These would not be reduced by discontinuing the Fresh Produce range, as they are necessary for Netto AS to be able to perform. As a consequence, the other product areas would have to bear higher allocations, which in turn would reduce their profitability.
These considerations show that activity-based costing can be used to calculate the estimated full costs of an activity. But these full costs cannot be relevant for decision-making if fixed costs are allocated to product or customer groups by means of an allocation key. In Flexible Standard Costing, proportional costs are allocated to product units according to their source. The fixed cost center costs are transferred however as blocks into the contribution margin calculation.
The ABC idea is consistent with GPK (Grenzplankostenrechung) and RCA (Resource Consumption Accounting), to the extent it assigns proportional costs to products. But it also allocates fixed costs without appropriate cause-and-effect allocation keys (or cost drivers). This application of other allocation keys does not reduce the fixed costs and can lead to erroneous decision making based on misleading costing information. As with any costing method, care must be taken when using ABC costing data to ensure the information used is appropriate for the decision being made.
Planned to actual comparison in stepwise Contribution Margin Accounting shows where corrective measures must be taken first.
Complete Variance Analysis
The step-by-step contribution margin accounting, also called sales performance accounting, allows for a complete variance analysis. All variances from plan are to be identified and analyzed to derive corrective measures or new plans.
Complete Variance Analysis
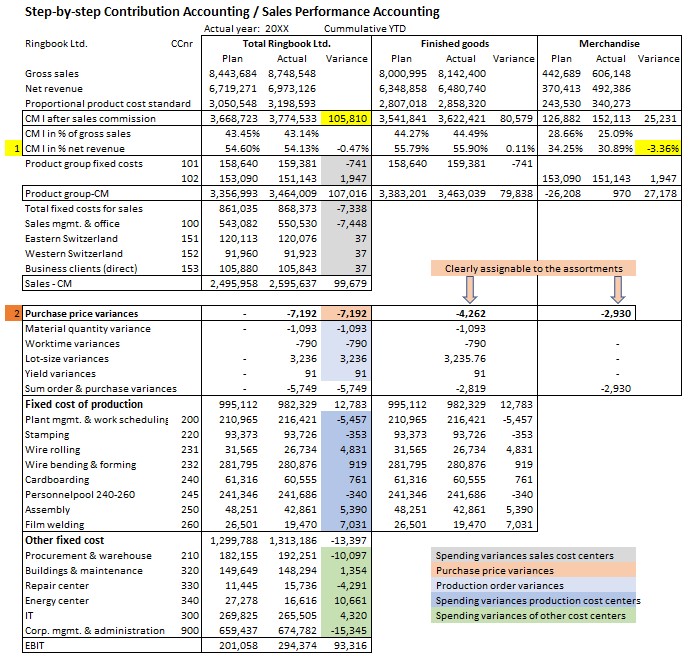
In the report for year 20XX of Ringbook Ltd. it can be seen that
Gross sales grew mainly due to increased sales in the merchandise product range (+36.9%). In both assortments, somewhat higher sales deductions were granted in order to realize the sales. As a result, CMI I as a % of net sales for merchandise fell by 3.36%. Overall, the absolute CM I increased by 105,810 (see yellow fields).
Sales promotion costs (fixed costs of the product groups) are clearly attributable to assortments but not to individual product groups. They did not deviate significantly from plan. The cost centers sales management and sales territories show minor spending variances in their cost centers. Since the sales organization works for all products, its fixed costs can only be allocated to the company as a whole (see grey fields).
The purchase price variances (line 2, red fields) could be assigned to the two assortments because all raw materials and supplies are consumed for the company’s own products. The price changes of the suppliers of the merchandising goods appear in the corresponding assortment.
Production order related variances can be collected for each production order. Here, the summarized values per variance type are presented for the responsible production management. These variances refer only to semi-finished and finished products manufactured in-house. Therefore, they are shown in the column for the goods manufactured by the company (light blue fields).
The spending variances (target costs – actual costs) remain. These arise in each cost center per cost-type. In the stepwise contribution margin accounting, they are shown by cost center or summarized by functional area (dark blue fields for production and light green for other cost centers). Favorable spending variances increase the EBIT. They are the expression of the fact that fewer actual costs were incurred than target costs during the period under review. This corresponds to a productivity gain relative to plan.
This company-specific design of the step-by-step contribution margin accounting shows which individual areas of responsibility contributed to what extent to the improvement in EBIT of 93,316.