“Imputed depreciation is a cost equivalent for the devaluation of long-term usable operating resources (see Wolfgang Kilger, Flexible Plan Cost Accounting and Contribution Margin Accounting, 9th Improved Edition, Wiesbaden, 1988, p. 398).”
Imputed depreciation amounts are intended to lead to corresponding amounts of money being “reserved” in the financial assets for replacement investments, in order to procure replacement assets if necessary and thus be able to continue to meet the operational purpose. The devaluation equivalents mentioned by W. Kilger are to be calculated on the basis of the replacement values of the investments from the point of view of value retention.
It follows that imputed depreciation should not be calculated on the basis of the historical acquisition value of long-term working assets, but on the amount to be paid at the end of the year for equally efficient assets. From our point of view, a company’s profit potential is only preserved when the equally efficient operating resources can be procured again. As a consequence, there is no distributable profit for the owners/shareholders until the imputed depreciation calculated from the replacement value has been deducted. Only the residual amount can be distributed with a clear conscience if the company is not to suffer a loss of substance.
In order to determine replacement values and imputed depreciation, it must be clarified annually what changes in the purchase prices are to be expected for the various fixed assets. There are many reasons for imminent purchase price increases or expenses for updates:
Inflation in procurement markets
New technical or legal regulations to be complied with
Changed safety regulations for the operation of the facilities (and buildings)
Adaptation of computer programs, program extensions and release changes
Switching to another machine supplier because the previous one no longer exists.
It also happens that equipment to be replaced becomes cheaper to purchase because physical plant components are replaced by electronics or metal by plastic.
In the event of expected increases as well as reductions in the purchase prices of fixed and intangible assets, imputed depreciation for the plan year must be recalculated and taken into account in management accounting. Like all other costs they determine the annual internal profit.
Imputed depreciation should not only be calculated for long-term assets such as buildings, facilities, machinery and vehicles. Increasingly, the resources also include rights and potential benefits of a non-physical nature such as ERP- and CRM-systems, rights of use and sales, purchased customer addresses, time-limited licenses of use. If such potential benefits lose their value over time and require new investments to preserve their benefits, the corresponding estimated amounts have to be taken into account in the replacement value, which in turn leads to higher imputed depreciation.
Sustainably successful corporate management requires the inclusion of imputed depreciation and amortization in the income statement. This prevents funds from being distributed to the owners, which will be necessary to maintain the company’s potentials for success and thus its continued existence.
If private individuals want to buy a new car, they first determine how much they will have to pay for the desired vehicle including all equipment features. This results in the gross purchase price of the vehicle, which is then also shown in the purchase contract. If her used car is traded in, the trade-in price is deducted. She may prefer a leasing contract with monthly payments. When making the decision, the private individual mainly considers the cash outflows at the time of purchase and the ongoing annual expenses. Such an investment calculation only takes cash flows into account.
Why write off?
A company, on the other hand, must present a financial statement with a profit and loss account every year. To determine the annual profit for the period, it must deduct the annual loss in value of the car, i.e. depreciation, from the revenue generated and show it in the income statement and in the balance sheet.
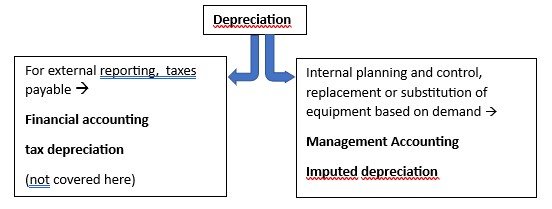
Depreciation is the value-based expression of the annual loss in value of physical and intangible assets. External reporting and the calculation of taxes payable are governed by legal regulations. These regulations are intended to ensure that all taxable companies report according to the same rules and are therefore treated equally by the state. The management approach, on the other hand, focuses on the loss in value of an asset or right due to its use and the expected remaining useful life of it. These different purposes can lead to different depreciation amounts being included from an operational perspective than those permitted under tax law.
External or internal valuation
In order to treat all their taxable companies equally, many countries issue commercial and tax regulations on the valuation of assets, the depreciation methods to be applied and the useful lives permitted for the calculation. In Germany, for example, these are the depreciation rules (depreciation for wear and tear), cf. the depreciation table of the German Federal Ministry of Finance (Bundesfinanzministerium – AfA-Tabelle für die allgemein verwendbaren Anlagegüter (AfA-Tabelle “AV”)). For internationally operating and reporting companies, the rules of international reporting standards such as IFRS or US GAAP are applied.
For the managers controlling a company or a group these external valuation and depreciation rules are of secondary importance. They want to be able to assess whether the depreciation and amortization charged to the internal financial statements will be sufficient to maintain the company’s performance potential in the future so that it can continue to generate profits in line with the market. Distributions (dividends) to owners and shareholders should therefore only be decided once it has been ensured by means of imputed depreciation and amortization that funds that will be required to maintain the profit potential will not be distributed.
“Management control plans, controls and measures the implementation of guidelines, strategies and operational objectives, see the management control definition.
From this understanding of management control it can be deduced that management accounting must take into account imputed depreciation, not financial depreciation. This is because it is about shaping the future of the company and only to a limited extent about external profit reporting.
Cost price is the total cost of a company in a period, adjusted for changes in inventory. According to Wikipedia.org, this includes material costs, manufacturing costs, research and development costs, administrative costs and distribution costs. as well as imputed interest for assets required for operations (see German Guidelines for Price Determination on the Basis of Cost of Goods Sold (Annex to Regulation PR No. 30/53 of November 21, 1953, Notes 43 – 45)). If the net revenues exceed the cost price, the company starts to make a profit.
This statement is true for the company as a whole but it misleads when it comes to management control. Who wants to calculate the cost price of an article, a customer or a subdivision of the company, has to break down the fixed costs to product units. But as there is no direct cause-and-effect relationship between the company’s fixed costs and the individual product unit sold, this can never be done properly
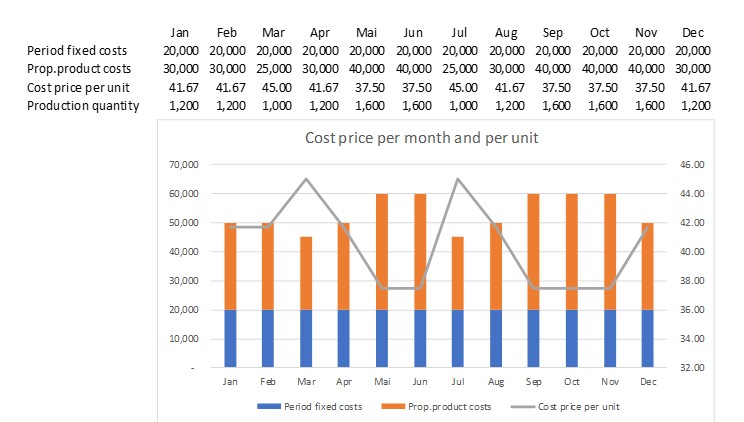
To calculate the profit contribution of an item, the cost price per unit of a product or service unit sold must be calculated. All fixed period costs must therefore be allocated to the product units sold. For this purpose, an overhead rate is determined for the calculation of the unit cost of goods sold. If the sales quantities or the fixed cost blocks change, the cost price per unit unit also changes. This affects inventory valuation and, even more important, the management of sales and production.
As long as neither the bill of materials nor the routing and neither the material purchase prices nor the proportional planned cost rates of the cost centers involved in production change, the proportional costs incurred per unit produced remain the same. However, distributing the fixed costs to a different production or sales quantity, results in different cost prices per unit. Neither production nor sales are responsible for this, only the capacity utilization.
Cost price is irrelevant for descision-making
In the example, the monthly cost price per unit of goods sold changes because the fixed costs are divided by the production quantity of the period under review. If inventory receipts and issues are valued monthly at full productions costs, they include a portion of the period’s fixed costs. The value per unit thus changes every month. The fixed costs of other functional areas of a company are usually added as percentages to the full production costs. Although cost of goods sold is necessary in external reporting, it is not useful for corporate management purposes:
If the really paid purchase prices deviate from the planned ones, first the purchasing department is responsible for the variances.
If in the production processes more direct material is consumed per unit produced than planned (or more semi-finished products), the production management is responsible.
If the standard times for the manufactured product units are not adhered to in the production cost centers, it is up to the respective cost center managers to take corrective action.
The data required for this can only be obtained if the splitting into proportional and fixed costs has been set up in the management accounting system. This can be achieved with marginal costing (flexible standard costing), see the posts “Full product costs are always wrong” and “Complete variance analysis“).
Since the demand, respectively the customers and the ability of one’s own sales organization determine the net revenues, it is necessary to compare the latter with the proportional product costs of the services and products sold. Our experience shows that most companies sell their items at different contribution margins per unit. The sum of all contribution margins achieved must be sufficient to cover all fixed costs and the targeted profit. An item that does not cover its calculated cost price can still make a considerable contribution to covering fixed costs.
The aim is always to cover all fixed costs and all variances with the contribution margins from the units sold, while at the same time achieving a profit in line with the market.
Initial situation: In the annual plan derived from strategy and medium-term plans, it is determined which items (services or physical products) are to be manufactured at what cost. For this purpose, the planned proportional production costs per unit are to be calculated in the costing system. In the sense of Management by Objectives the responsible persons have the task of adhering to these planned proportional product costs in each production order. This requires that each responsible person (e.g., production managers and project managers) must be able to track which costs were directly caused by an order. This is because they can only take responsibility for the cost elements that they can directly influence.
Three types of costing are distinguished because they serve different purposes:
Standard costing: Determination of the planned costs of a unit of an item (physical product or service) as part of annual planning. This costing results in the (annual) planned costs per unit produced.
Precalculation: On the basis of the planned costs and the actual quantities ordered, the planned costs of an order to be actually executed are calculated. This is because the actual incoming orders rarely match the planned quantities. Precalculation forms the basis for the target to actual comparison of a production order that has been placed.
Post-calculation: Comparison of the costs incurred in the actual order compared to the precalculation.
With this target to actual comparison managers are enabled to identify the order items that have deviated from the plan. With this information they can intervene in the next periods and find measures that will lead to achieving the target costs again in the following periods. In addition, it must be ensured that cost variances are not passed on to subsequent levels. This is because these are only responsible for their own variances.
Cost center-managers as well as production- and project-managers are responsible for variances in the production area. In decision-relevant management accounting the variances of production and all cost centers should not be charged on, neither to the warehouse nor to the sales organization, since the latter cannot be responsible for such variances. For management-relevant Profitability Analysis (step-by-step contribution accounting), it follows that during the year all warehouse receipts should be valuated at proportional planned production costs and the variances should be shown in the (monthly) Profitability Analysis. This is because the variance types mentioned can neither be allocated to the products nor to the sales organization nor to the individual customers according to their cause.
The next two posts show how the various types of variances are shown in Profitability Analysis in a way that is appropriate to the levels and responsibilities, where they are to be shown, and how inventories are to be valued.
Useful Management accounting systems must provide the data relevant for decision-making.
Decisions – Responsibility – Causality
CZSG Controller Zentrum St. Gallen/Switzerland introduced many decision-relevant planning and control systems mainly in German speaking countries. The basis was always “Grenzplankostenrechnung GPK” and the further developments arising from it. The applied management accounting principles correspond almost 100% to the recommendations for the design of “Resource Consumption Accounting RCA” according to Larry R. White (Journal of Corporate Accounting & Finance, Volume 20, Issue 4) and of the Profitability Analytics Center of Excellence PACE.
Who decides what?
Many chief financial officers and cost accountants see the purpose of management accounting primarily as presenting an organization’s financial results in accordance with the requirements of local accounting laws, IFRS and USGAAP, local tax laws and regulations for setting transfer prices between related companies, and other regulations.
In our eyes the purpose of management accounting is first and foremost to provide decision support for managers at all hierarchical levels. After all, they are responsible for the results to their superiors. The focus is on management support, not on external reporting.
Decisions – Responsibility – Causality
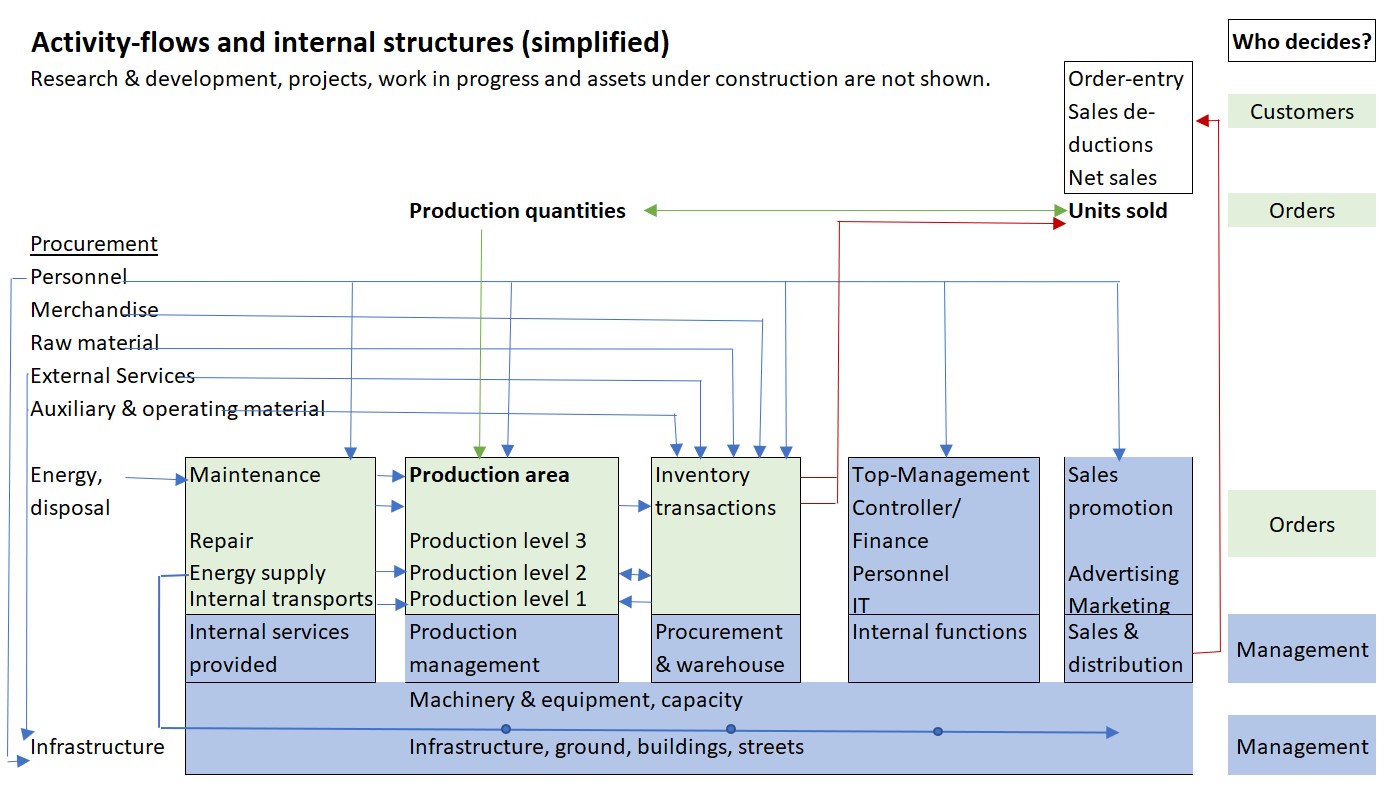
Customers decide whether they want to place an order and at what price. In this way, they also indirectly decide the proportional costs of the products or services to be sold and manufactured. Managers at all levels decide how the necessary offers are to be made and what personnel and machine capacities will be required to process the orders won and, in doing so, to achieve a profit with the company in line with the complete market.
In strategic and operational planning, managers at all levels must define activities, quantities and capacities. Consequently, consumption according to bills of materials and work plans as well as activity-based cost center budgets are required for planning and subsequent control. Only when these quantities and activities are known can they be valued in monetary terms. A management accounting system that is suitable for decision-making must therefore provide those quantities, activities and valuations which a responsible manager can control himself and thus take responsibility for. This also requires that the manager can always compare the planned values with the actual values of his area.
This starting position applies to manufacturing companies, service providers, hospitals, retailers as well as banks and government institutions.
No financial accounting system can provide this data, as it only represents values. Valuation regulations from tax law, from accounting standards (US GAAP, IFRS) or from specifications for the determination of international transfer prices are also irrelevant in accounting for management, because cost center managers, product managers and salespersons cannot change these values themselves.
Responsibilities of different managers
Since managers are responsible for achieving their objectives, it is recommended to list their responsibilities.
Production manager:
Timely processing of dispatched production orders
Ensuring stock receipts of semi-finished and finished products (valued at proportional standard production costs)
Adherence to target consumption rates for materials and cost center activities in accordance with the pre-calculation of released production orders, valuation of consumption at planned purchase prices and proportional planned cost rates
Compliance with the planned costs of its own cost center(s)
Notify other areas when capacity constraints become apparent.
Cost Center Manager:
On-time completion of manufactured work
Adherence to the pre-calculated times in the production orders to be processed
Adherence to target costs (flexible budget) of own cost center, taking into account pre-calculated times and work performed.
Sales Manager:
Achievement of planned net revenues per period (invoiced).
Compliance with the planned costs of his own cost center(s)
Meeting the agreed delivery dates to the customers.
Purchasing Manager:
Procurement and on-time availability of all goods and services to be purchased.
Determination of planned prices (standard prices) for raw and auxiliary materials as well as services to be purchased (on this basis the standard cost calculations are prepared)
Informing sales and production in the event of major variances between actual and planned cost prices.
Who is responsible for depreciation?
The manager in whose cost center the asset is located,
the managers who determined the planned useful life of an asset on the occasion of the investment decision,
the financial manager or the controller who determines the depreciation method (preferably fixed depreciation from the replacement value of an equally efficient asset)
Depreciation is mainly a period cost, since most assets do not need to be replaced because they no longer function, but because they are technologically obsolete.
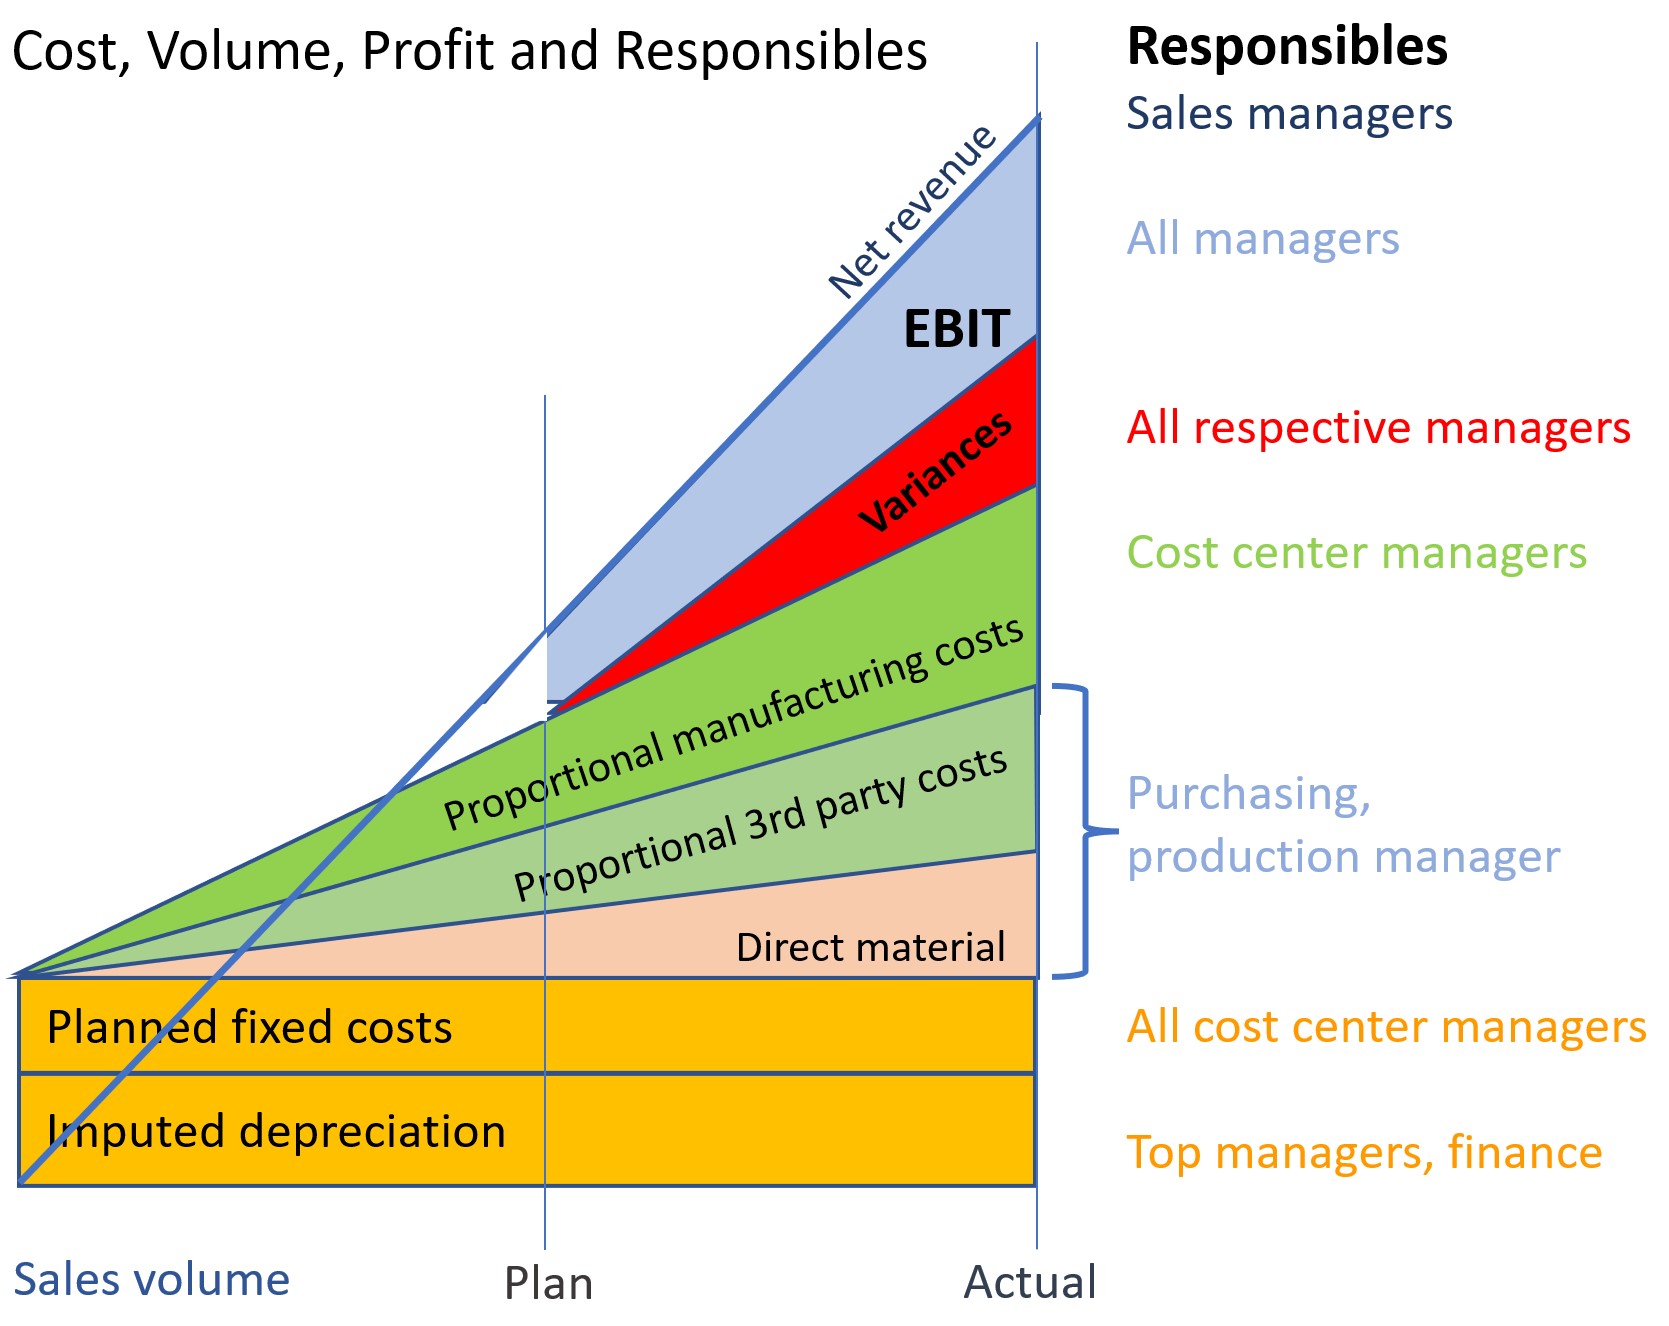
In the stratified presentation of the origin of results and profit, the contribution of the individual responsibles and their employees becomes apparent:
Decision-Making, Responsibility and Causality
Who is responsible for idle capacity?
The managers who bought too large a plant,
the salespeople who sold too little
possibly cost center managers, if they do not point out idle capacity to their colleagues.
From this it can be deduced that it makes little sense to allocate costs of idle capacity (especially personnel and depreciation costs) to cost centers or product groups. As mentioned, imputed depreciation and personnel costs are charged to cost centers because they are observed there.
Strong and weak causalities
In our opinion, a strong causality is given if the consumption of an input good, e.g. the output of a cost center or an employee, is directly caused by the storable or saleable product. This is the case if a routing or/and a bill of materials can be created for the product or the service unit performed. In Grenzplankostenrechnung GPK, therefore, only proportional costs are charged to products or services, and the remaining fixed costs are transferred to stepwise contribution accounting. This is because fixed costs can only be changed by management decisions, such as firing an employee or purchasing a machine.
Weakcausalities do not show a direct dependency between output and input.
Example 1: Because the headcount has increased, the HR department needs an additional employee for everyday personnel support. There is no rule how many employees one person in the personnel department can supervise. It is a management decision whether to hire the person or not. The costs directly attributable to a manufactured product do not change as a result of the increase in staffing levels, since no changes are required in either the bills of materials or the routings. But the fixed costs of the company increase.
Example 2: A company fills gas cylinders and delivers them to customers by trucks (see the case study “Le Petomane Gas in the PACE homepage“). Delivering to a remote customer requires an additional hour of travel time, resulting in corresponding fuel and labor costs. These could be saved if the customer is no longer served. On the other hand, the net sales minus the proportional costs for the delivered gas cylinders, i.e. the contribution margins I of this customer would be eliminated. This results in: + omitted transport costs – omitted contribution margins.
The proportional product costs per filled gas cylinder in the finished goods warehouse can be clearly determined since material consumption and work schedule for filling are defined in the technical bases (strong causality).
Example 3: Most companies have a central IT cost center for the implementation, operation and maintenance of applications and data. The resulting data and evaluations are used (to varying degrees) by many cost centers. In cost accounting, therefore, a search is often made for cause-effect chains by means of which the IT costs can be charged to the receiving cost centers. Mostly this search is unsuccessful because both the data sets and the applications are used by a wide variety of cost centers (very weak causality).
Nevertheless, many financial managers and cost accountants try to allocate the fixed costs of the IT department (including depreciation) to the various cost centers and from there to the manufactured products by means of one or more allocation keys. After all, according to the widespread opinion that each product must bear its share of the total fixed costs. However, the IT manager plans and controls the costs of the IT department and is consequently also responsible for them to the management. There is no need to allocate costs to individual cost centers and products. The contribution margin from sales must be sufficient to cover all fixed costs plus the target profit.
Insight:
In Grenzplankostenrechnung GPK, only proportional costs are allocated to manufactured products because they were directly caused by the products (only strong causalities). Therefore, in management-oriented cost and revenue accounting, inventories should also be valued only at proportional (standard proportional product costs). This is because fixed costs are period costs and, as such, should be shown as blocks in the contribution margin accounting. They are to be controlled in the cost centers.
Precisely: In GPK and in Resource Consumption Accounting RCA, fixed cost allocations have no place because these allocations are an attempt to delegate cost responsibility to units that have no direct possibility of influencing the costs at the point of origin.
Of course, it makes sense to include fixed costs in pricing for individual customers. However, in our view, this is activity-based pricing, not costing. Therefore, considerations about setting offer prices and conditions should be made outside the management accounting system, especially in the sales organization.
If in the Costing Levels Continuum Maturity Model from Gary Cokins the levels 11 and 12 are to be reached, all allocations of fixed costs must be eliminated, because otherwise no useful simulations are possible. IFAC-Evaluating-the-Costing-Journey_0.pdf
Target to Actual Comparison shows the difference between the should be-costs and the actual costs in a cost center
Target to Actual Comparison
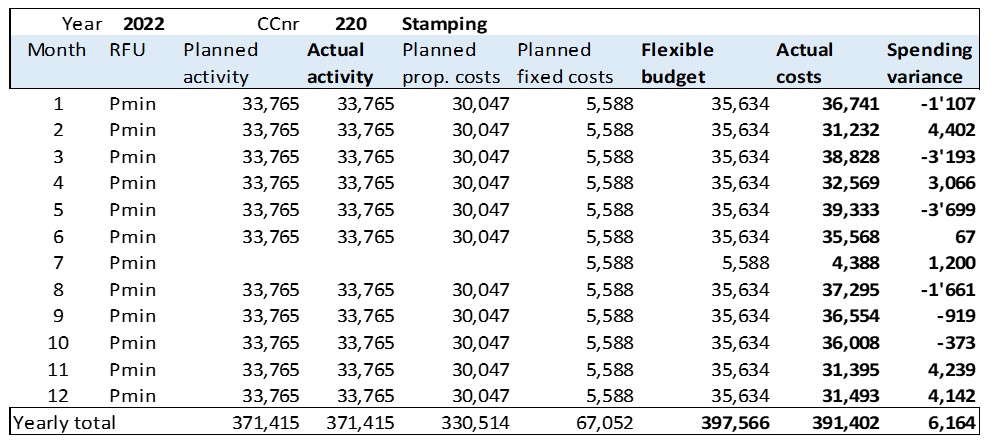
The great benefit of comparing the flexible budget with actual costs is that cost center managers can see every month how well they succeeded in implementing the plan, taking into account the orders processed. The financial goal of a cost center is to meet the cumulative flexible budget costs for the year. If the flexible budget and the actual costs are determined as described in the post “Flexible Budget”, corrective measures can be sought quickly. These should bring the cumulative spending variances back to zero in the next periods, if possible. Theoretically, a target to actual comparison could be made “real time”, i.e. daily. But because the real personnel costs and other cost types can only be calculated after the end of each month, it is recommended to create monthly comparisons per cost center.
The example shows the monthly target to actual comparisons of the cost center Stamping:
Target to Actual Comparison
The spending variances show how well the cost center manager succeeded in keeping to the planned costs adjusted to the effective performance in the individual months. A positive spending variance means a productivity gain compared to the plan, a negative the contrary. These variances are corrections of the planned fixed costs.
In the month of July, Ringbook Ltd. is on vacation. Therefore, no activity is listed there, but parts of the fixed costs, especially depreciation, are also incurred in this month. The flexible budget costs are calculated according to the formula “actual output times proportional planned cost rate + planned fixed costs”, the actual costs according to the real charges.
For the year as a whole, the flexible budget was undercut by 6,164.
Actual costs
The costs charged to a cost center for a reporting period (usually a month) are recorded in various subsystems:
Invoices from external suppliers: Recording of the invoice receipt in accounts payable with specification of the consuming cost center.
Consumption of auxiliary and operating materials from the warehouse: Recording by means of material consumption slips by multiplying the purchased quantity, valuated with the planned purchase price of the auxiliary or operating material. The planned purchase price is used for valuation because the purchase price variances are reported to the purchasing department, since this department triggers the purchase orders.
Personnel costs: Debit of the presence hours of the month of the employees of the cost center, valued in each case with their planned presence hour rate (data source is the personnel cost plan).
Charging of activities of other cost centers: Units consumed during the reporting period (mostly hours, kWh, km) valued at the proportional planned cost rate of the providing cost center. As a result, neither the fixed costs of the issuing cost center nor the variances incurred there are passed on.
Overall: The fixed costs and the purchase price variances remain in the sender cost centers, since they can only be recorded and accounted for there. In this way, target to actual comparisons are created in the receiving cost centers without including price or cost-rate changes from serving areas. The resulting variances are the responsibility of the respective cost center manager.
Calculating the planned costs of the actual services provided.
Flexible Budget
When performing a target to actual comparison, cost center managers should be able to check monthly as to whether or not costs they can manage themselves are “under control”. Given that the annual plan is approved by the organization’s management who releases the cost center budgets, the budget must be adhered to. However, during the year various factors can deviate from the plan, including:
Sales and production quantities,
Purchase prices,
Manufacturing processes efficiencies, and
Employees retention rate.
A simple comparison between planned and actual costs does not help cost center managers in their search for possible corrective measures because they lack a reference to the actual performance of the period under review. As a benchmark the flexible budget of the cost center should be calculated:
Flexible budget costs =
actual activity x proportional planned cost rate + planned fixed costs.
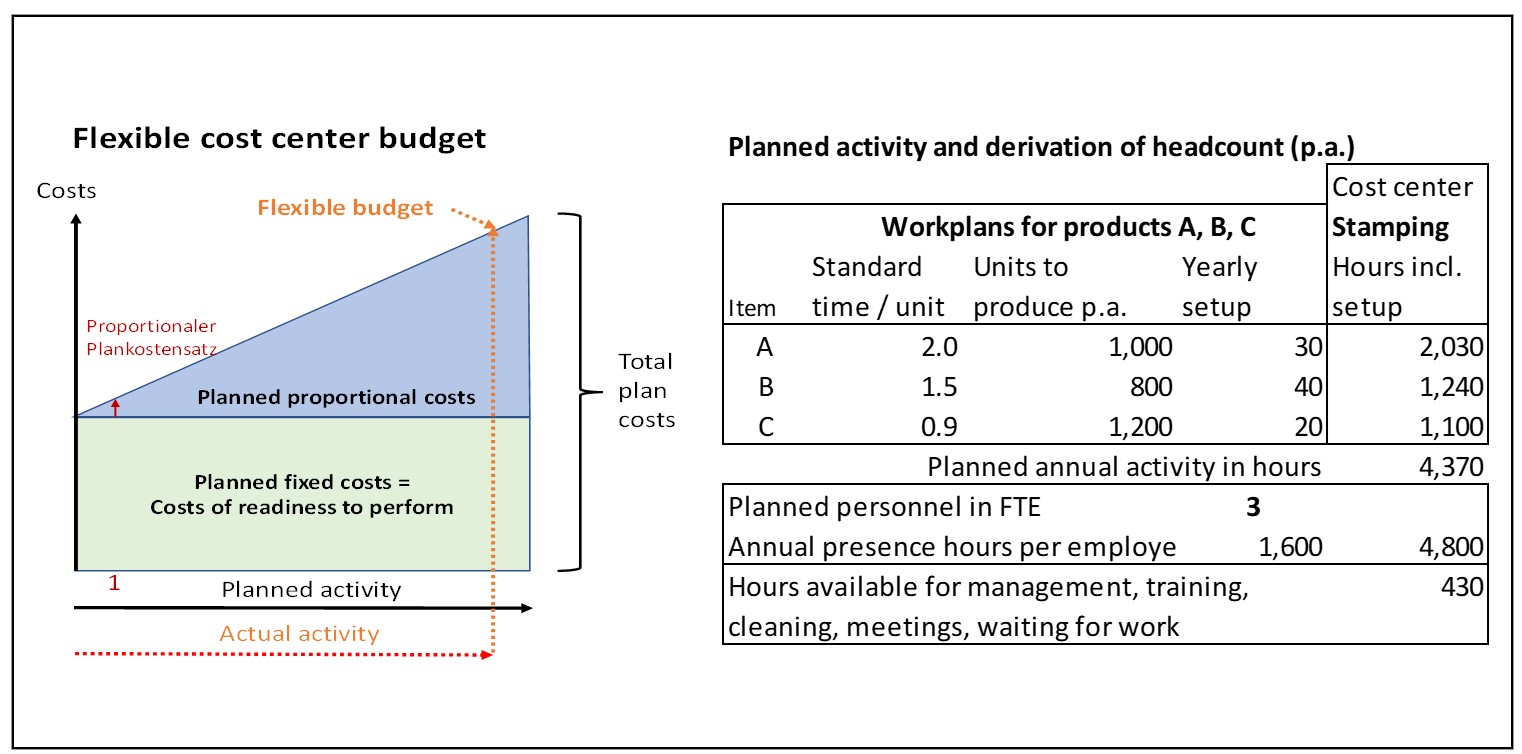
The flexible budget shows the planned cost of work actually performed in a period. If the activity performed in the period under review deviates from the planned activity, the proportional costs of the cost center will change, but the planned fixed costs should not. In the example below, actual employment is slightly less than planned employment. Therefore, the proportional plan costs is less than the annual plan, but the planned activity capacity (fixed) costs remain the same.
Flexible budget
The flexible budget cost is thus the cause-related yardstick for assessing the total costs actually incurred by the cost center. If the cost center managers keep to their flexible budget, they will have achieved their cost target. If negative variances from the target costs occur, ways must be found to cumulatively reach the flexible budget again in the following months.
If cost centers perform activities that are not directly caused by a production order, a customer order, or by internal projects (e.g. research and development), they also have no planned or actual activity and consequently only fixed costs. In these cases, the flexible budget corresponds to the planned costs.
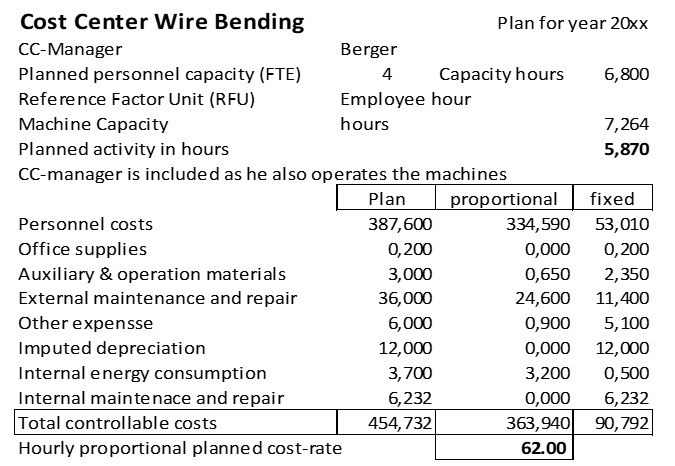
For the wire bending cost center in the example company the annual plan is as follows:
Cost Cetner Wire Bending
The installed capacity of the production equipment is 7,264 hours, which is sufficient for the planned production time.
The cost center has a planned workforce of 4 people who are planned to work a total of 6,800 net hours. This includes the working time of the cost center manager for planning and controlling the cost center.
The complete planned personnel costs of the cost center totals 387,600. The average hour worked (including the cost center manager) will thus cost 57.00 per hour (presence time).
According to production planning 5,870 employee hours will be necessary to execute the planned activity. This means that 5,870 hours at 57.00 per hour will “slip” into the products to be manufactured. This corresponds to 334,590 planned proportional personnel costs. The 53,010 difference between the planned personnel costs represents the costs for work not directly related to the products, i.e. the planned fixed personnel costs for the year.
In line with this, the other planned costs were divided into their proportional and fixed portions. Dividing the proportional budgeted cost of 363,940 by the planned activity of 5,870 hours yields a budgeted hourly proportional cost rate of 62.00 for wire bending. This rate is used to calculate the proportional costs of all products that will be processed in this cost center (see the post “Standard Cost Calculation of Products”).
If the activity of the issuing cost center is caused by a direct order of the receiving cost center or by its activity, there is a direct cause-and-effect link between the serving and the receiving centers. The planned proportional cost-rates can thus be charged to the receiving cost centers. The issuing cost center has its own planned and actual activity. The activities it performs for other cost centers can be measured. (Examples include repair and maintenance shop, laboratory, and energy cost centers). Thus, the respective cost center also has a proportional plan cost rate and its flexible budget is dependent on the activity performed for others during the period.
If the activities of a cost center are performed for the entire company, there is no direct cause-and-effect relationship between the producer of the activity and the users of the output. Therefore, the costs of such cost centers cannot be allocated to other cost centers according to their cause (e.g. reception, personnel administration, internal training, sales, production planning, finance, the majority of IT costs and top management). The IT costs for the ERP- or for the management accounting system are incurred for all cost center managers who use ERP data. The costs of generally used services cannot be charged to the users according to their origin (forced consumption). Due to this lack of causation, the allocation of fixed costs to other cost centers makes no sense. In other words, fixed costs should not be allocated to other cost centers, cost center managers should assume responsibility for their own flexible budget.
Flexible budgets are thus a prerequisite for the introduction of a Resource Consumption Accounting system RCA and for Contribution Accounting.
Financial evaluation of multi-year projects at the time of decision-making.
Dynamic Capital Budgeting
The basic principle of an investment: Money is spent today in order to have more cash returns or less cash outflows in the future. Companies, NGO’s, NPO’s and private investors have to decide again and again whether they should invest their available money in companies, plants or process improvements. An investment decision requires a plan-calculation, which should show whether the planned cash outflows and cash inflows can achieve a return in line with the market during the expected useful life of the investment.
Usually investments are expenditures for the provision of a service potential that are intended to generate higher cash inflows or reduced expenditures during the planned period of use.
Simple example 1: Contracting out the maintenance of the garden surrounding the plant to an external organization.
Consequences of this decision are: Additional expenditures for the grounds maintenance contract and eliminated expenditures for paying the former in-house gardener.
Complex example 2: Production and sale of a new product group by an existing company.
In example 1, from a financial point of view it is sufficient to compare the balance of the expected payments for the grounds maintenance contract with the personnel costs for the work previously performed internally.
In example 2, additional net sales and thus additional contribution margins are to be achieved with a newly introduced product group. To generate these additional cash returns initial investments in fixed assets will be necessary, the expansion of net revenue will increase receivables and inventories, and more personnel will be required in individual functional areas. These actions will lead to additional cash outflows. It should also be taken into account that both net revenues and cash outflows will be subject to the life cycle of this new product group, i.e. will lead to different net cash flows in each year of the investment project.
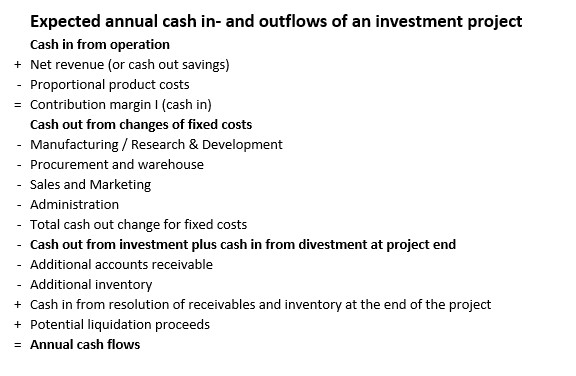
In both cases, cash flow analyses must be prepared for the upcoming decision. For the more complex example of the introduction of a new product group, these considerations must be prepared for a multi-year horizon, because the inflows and outflows of money can occur in different years. In our experience the following structure is suitable for this purpose:
Dynamic Capital Budgeting (only planned values)
This structure can be used generally for investment appraisals, since it contains all elements of cash inflows and outflows. Regarding example 1, the cash outflows would be the payments for the grounds maintenance contract, the cash inflows would be the saved cash-out personnel costs for the previous employee. The introduction of a new product group (example 2) requires the entry of all items listed in the table above because this investment project affects both the income statement and the balance sheet.
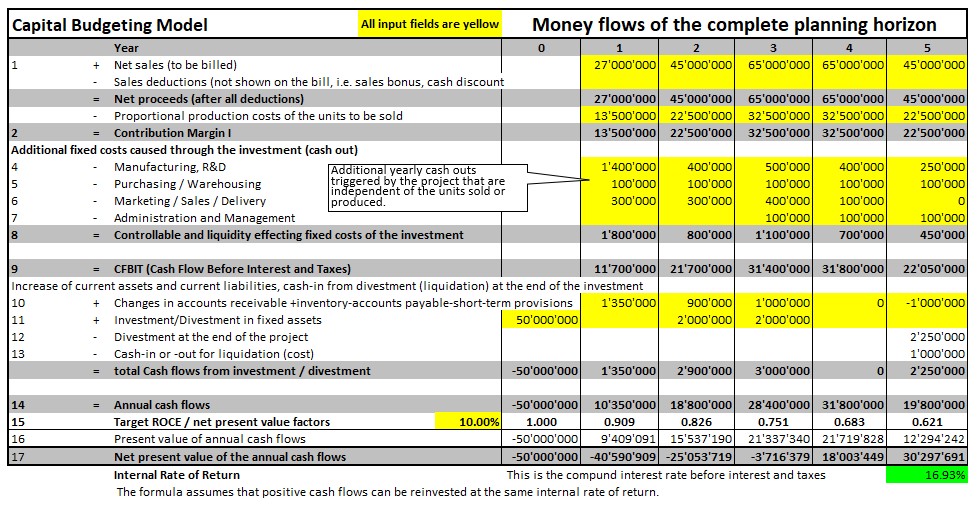
Therefore, it is advisable to prepare the investment appraisal in such a way that the expected annual cash flows can be identified and discounted for each year. In the product launch example, these cash flows are planned as follows:
Present Value of an Investment
Year 0 is the beginning of the implementation of the decision. The main investment of 50 million has to be paid then (line 11). For the years 2 and 3 it is assumed that additional investments will be necessary to increase the production capacity of the plant.
The annual net revenues expected from the project are entered in line 1. The development of the net revenue corresponds to the expected life cycle of the new product.
In line 2, the planned proportional costs of the expected yearly sales are calculated (50%).
In year 1, further payments of 1.0 million are incurred for introductory work. In addition, it is expected that the staff in Production Planning and Control will need to be increased, resulting in 0.4 million additional annual expenditure (line 4).
Further additional personnel are required in the areas of purchasing and warehousing as well as marketing / sales / distribution. The expansion of the business volume will also require an additional person in administration in the years 3-5 (lines 5-7).
The total annual cash outs for internal tasks of this project (additional personnel) can be seen in line 8).
Line 9 shows the net benefit of the investment project (yearly net cash inflows).
Lines 10 and 11 show the net impact of the project on fixed assets, accounts receivable and current liabilities over the years.
At the end of the project (here year 5), the built-up receivables and inventories are liquidated again. There may also be liquidation proceeds for the asset that is no longer in use (lines 10, 12 and 13).
The annual balance of cash flows is shown in line 14.
The example shows 5 plan years but can be extended for more years as needed.
Adding up the nominal yearly net cash flows in line 14, it can be seen that the investments will be completely paid back during year 3 (simple payback period).
The time value of money
Anyone who provides money, whether it is the company itself or an investor, expects to be remunerated for this service in the form of interest. If, for example, an annual interest rate of 10% corresponds to current money market conditions, a company must pay an interest of 100 for a loan of 1,000 at the end of a year. If the lender is to make the money available for several years (example 2), he will ask himself whether he will be remunerated for his investment with compound interest. Consequently, from his point of view he wants to know at the time of decision what the present value of the investment will be over the entire term of the loan and whether this return will stand up in comparison to other possible investments.
Investors therefore ask themselves: How much will I get back for my investment at the end of one year or at the end of the project? If, as in the example, he sets a target interest rate of 10% per annum, the result is:
The 100 are to be paid at the end of the year. So the value of the interest payment at the beginning of the year, respectively at the time of the decision for the investment is 90.9091 ((100 : (1+interest rate 10%) = 90.91).
If the interest of 100 accrues only at the end of year 2, the 90.91 must be divided again by the interest rate (90.91 / (1+interest rate)) = 0.826). In the compound interest calculation, the formula 1 / interest rate ^number of years is used. This results in the present value factors, which are shown in line 15 for the rate of 10%. The corresponding present values of the plan years are shown in line 16. Line 17 shows that the accumulated present values will only at the beginning of year 4 be sufficient to pay for all the investments and divestments and for the 10% compound interest (lines 10 and 11) at 10%.
Overall, according to the plan, by the end of year 5, the cumulative present values in example 2 should be 30.298 million higher than the net investments in all the years of the project. In setting up the example, it was assumed that the life cycle curve of the product group will go through its build-up and growth phase in years 1-2, will reach saturation in years 3 and 4 and that the phasing-out of the life-cycle will begin in year 5.
Pitfalls in the application of Dynamic Capital Budgeting
Depreciation has no place in an investment calculation. This is because by taking the investment amounts into account the cash outflows are already included.
Likewise, tax consequences of investments are generally not included, since the profitability rate to be achieved refers to the profit before deduction of interest and taxes.
Saveable tax amounts are also not relevant to the decision because taxes are calculated from the reported profit after interest. The latter can also develop negatively if an investment project is going well but the market situation leads to a drop in sales of other products and thus to less annual profit.
As the name implies, capital budgeting is a forward-looking view. The method is always based on planned quantities and values because it is intended to support decision-making in strategic and operational planning. Whether the investment has really increased productivity can only be determined by evaluating the actual data from management accounting.
With the present-value approach the investment appraisal becomes dynamic.
Download the Excel model for the quantification of investment projects here and adapt it to your own needs. Copying the formulas in new rows allows to include additional years. The model is particularly suitable for the quantification of strategies. With the help of the Excel formula “Internal rate of return” also the internal rate of return of the project can be calculated (see the 16.9% on the right in line 18). This helps to compare competing projects. But it should be noted that this formula assumes that cash returns can also be reinvested at the rate of 16.9%.
Market rate of interest
In the presented example an interest rate of 10% was assumed. But which interest rate should be applied for the assessment of a real project plan or a general investment?
For this purpose, the interest rate in line with the market for companies with the same risk must be determined. The procedure for doing this is described in the post “Profit in Line with the Market“. There, it is also noted that the 10% assumed in the example above correspond to the market reality in German speaking countries and in the US.
Because many organizations operate internationally, communication is increasingly multilingual. For this reason, we have expanded and updated our overview of technical terms in the world of controlling and management control systems.
Find more than 2,500 technical terms in English, German, French and Italian.
It seems more interesting to use the activity-based idea for finding, setting and negotiating sales prices, that means, for Activity Based Pricing than for costing.
Activity Based Pricing
Five of ten case studies published so far by the Profitability Analytics Center of Excellence PACE (see Management Accounting Practice Reports) deal with the question of how the unequal, only partially measurable use of a company’s support areas and capacities can be taken into account in sales pricing for different customers.
Specifically, the following cost pools should be included in sales pricing for different customer/product combinations:
Costs of procurement and warehouse logistics, which vary for different product groups,
Scrapping costs for expired or unsaleable products per product group,
Distribution costs such as transportation, storage, replenishment of shelves, delivery cycle (daily, weekly, monthly) per customer,
Customer care costs for order processing, handling of returns and complaints and general support by the sales force.
Although these fixed cost blocks cannot be allocated to an individual product according to cause, it is possible to calculate average values per activity and then take these into account when setting prices for different customer groups or sales channels.
This does not change anything in the management accounting system or in the contribution margin methodology, nor does it change the decision-relevant internal inventory valuation (at proportional standard costs). This is because fixed cost center costs are related to executed processes.
Activity Based Pricing is intended to support marketing- and salespersons in justifying the estimated costs of fixed cost processes to customers. For this purpose, it is not necessary to adapt the management accounting system, which is used for planning and control, but parallel calculations can be created.
Application example Ringbook Ltd.
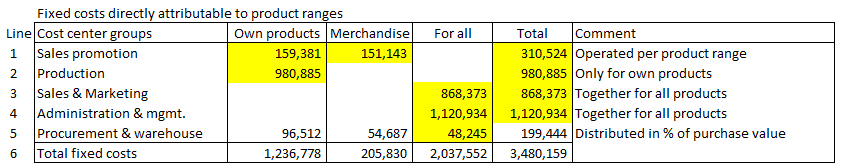
For the example company Ringbook Ltd. the following table shows the fixed costs for 2021 at the lowest product level to which they can still be clearly allocated, i.e., without using any fixed cost allocation factors.
Direct fixed costs per product range
Of the total fixed costs of around 3.48 million, 1.44 million can be allocated to the two product ranges, while 2.04 million are incurred for the entire sales organization. The fixed costs for purchasing and warehousing were broken down in proportion to the purchasing values of the areas (own products, merchandise, investments and projects (general)). This took place under the arbitrary assumption that the costs of the purchase department are driven by the purchase volume.
With this classification the lowest level of the allocation of fixed cost blocks is reached in the example company. For:
Sales promotion is performed in each case for all products of a product range, for all customer groups together.
In sales and marketing all products are sold to all customers and a sales order can include one or more positions.
In production, manufacturing orders are processed for both semi-finished and finished products, which is why their fixed costs are incurred for all manufactured goods.
Administration and management work for all products.
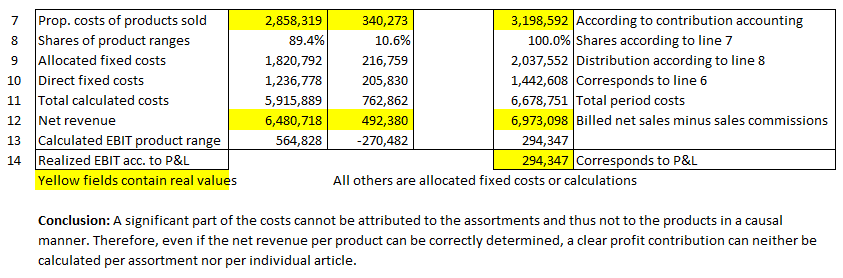
The next part of the table (lines 7 – 14) is based on the proportional manufacturing costs of the products sold in the two assortments of own products and merchandise. Since the calculation is based on bills of materials and routings of the individual articles and the purchase prices for the individual merchandise products are known, their proportional costs can be calculated for each assortment according to their origin (line 7). From this, the proportions of the general fixed costs per assortment can be calculated in lines 8 and 9 (89.4% and 10.6%). In line 10, the directly attributable fixed costs are taken from line 6 of the previous table. This results in the full costs per product range in line 11.
Activity Based Pricing
Comparing the net revenues in line 12 with the calculated full costs in line 11, reveals the calculated EBIT per product range (line 13). The total EBIT of 294,347 corresponds to the EBIT in the P&L (line 14).
After this allocation of fixed cost blocks to products it can be seen that the large share of EBIT comes from the own products. This was already apparent from the stepwiseCM-calculation.
If the activity-based fixed cost allocation presented here is taken as the basis for pricing, the prices of merchandise would have to be increased and those of the own products reduced. In this way, the merchandise would achieve a higher calculated EBIT and the lower prices of the own products would allow sales volumes to be increased. However, the merchandise range has only been sold for two years, so it is still being built up. The sales prices have been set by observing competitor prices, so a price increase would lead to a drop in sales. Otherwise it makes no sense to lower the prices of own products, because no significant increases in production volumes are possible with the existing production capacities.
In summary, for the estimation of activity costs the fixed costs of a cost center are to be assumed and these are to be compared with the process quantities. Using the example of a purchasing department it is understandable that an initial purchase from a supplier takes more time than a reorder. The personnel costs in the marketing department for producing a sales catalogue remain the same whether one or thousands of catalogues are printed. But the full cost of one catalogue will change. The question whether the costs of the catalogues are to be split between existing and potential customers remains open.
Outlook
The more interwoven the internal service relationships are in the production and marketing of products, the less meaningful a cost-based sales price calculation becomes.
For the determination of gross and net sales prices, the allocation of fixed costs to customers and products can be a support. However, the net prices of competitors are more important.
Activity Based Pricing should in any case take place outside of Management Accounting. It is used to set prices but does not directly change any costs.