Order Variances
Only a few variance types can clearly be assigned to the individual production order:
A lot size variance occurs when the production lots ordered deviate from the planned lot size in the annual plan. If the quantity ordered in a production order is larger than the quantity planned in the standard cost estimate for the article in question, the setup costs are spread over more units. As a result, the item produced costs slightly less per unit.
Yield variances occur when more or fewer “good quality” pieces result from the production order than planned. This happens primarily in process manufacturing, e.g. in the production of chips for processors or in chemical processes.
Material quantity variances occur when the input material did not fully meet the specifications or when the processing machines were not precisely adjusted. They lead to cost overruns in the respective production order.
Work time variances occur in the cost centers of production when more or less process time has been used than in the plan-calculation of the order. These over- or under-consumptions can be assigned to the individual order if the processing cost centers record their output per order.
Purchase price variances occur when the really price paid for raw materials and purchased services does not correspond to the planned price (especially in the case of inflation). They can be calculated in purchasing when the supplier invoice is recorded. Because the purchasing department negotiates the contracts with the suppliers, it is also responsible for purchase price variances.
As the same material can be used for different products and in many production orders, most purchase price variances can neither be assigned to an individual production order nor to a cost center according to cause. Direct assignment is only possible when materials or services are procured directly for a production order or a cost center.
Usually, raw materials and supplies are first stored in inventory and are only assigned to the production orders or cost centers when they are taken from the warehouse (material withdrawal slip). If actual purchase prices are used to value the inventory, the same material is in stock at different purchase prices. As a result, production would encounter a different average purchase price for the material each time they use this material.
If the production orders are debited according to the first in – first out principle, the order processed earlier still benefits from the lower-priced material, while the subsequent order is charged the higher prices. Valuing inventories with moving average prices does not help either. This is because each production order delivered to inventory results in new (proportional) unit costs and thus different valuation approaches in the warehouse for the same finished item.
If all warehouse receipts and issues are valued at standard purchase prices, this dilemma can be avoided. Production and sales can then (internally) purchase the materials throughout the year at the standard purchase price, and purchasing can determine the purchase price variance at the moment of purchase, i.e. when it occurs.
In the cost centers, the flexible budget costs, i.e. the planned costs of the actual activity performed, must be adhered to. The cost center managers are responsible to avoid negative differences between target and actual costs, i.e. spending variances, and for ensuring that these variances disappear in subsequent periods.
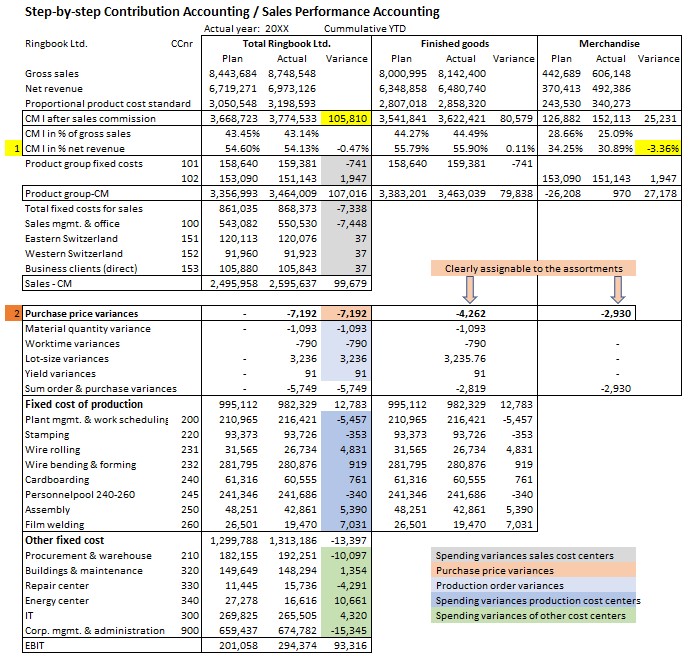
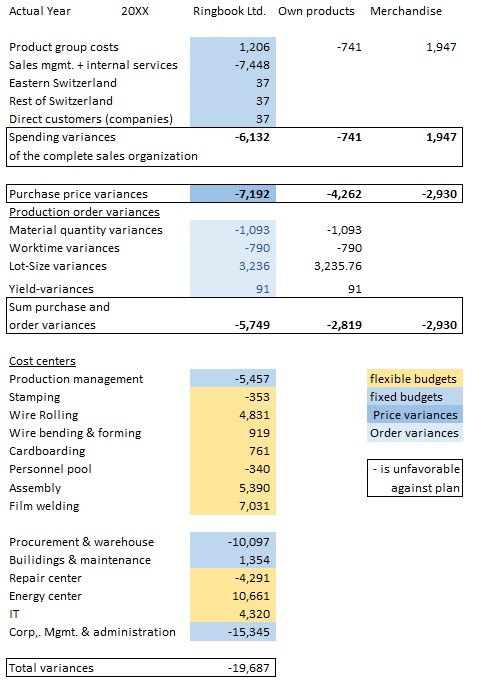
The example below has already been presented in a similar form in the post “Complete variance analysis“. All variances from the target are presented at the lowest hierarchical level to which they can be clearly assigned. This is also the place to intervene if these variances are to be avoided in the future.
This illustration only shows internal variances within the company. Changes in net sales are analyzed in contribution accounting.